Legacy Software Total Cost of Ownership Revealed
Your legacy software total cost of ownership is likely 3x higher. Calculate real TCO, hidden costs & when to modernize.
On this page
- Overview
- Why Your Legacy TCO Calculation Is Wrong by 70 Percent
- What the spreadsheet usually excludes
- Why this matters to a CTO
- The Anatomy of Real TCO Beyond Obvious Costs
- Direct costs that finance already sees
- Indirect costs that engineering carries
- Hidden costs that distort strategic planning
- How Technical Debt and Integration Complexity Inflate TCO
- The cost multiplier is architecture
- Integration debt is the hidden tax on every roadmap item
- Why waiting makes the denominator worse
- Quantifying Opportunity Costs and the Agility Tax
- Agility loss shows up before finance sees it
- The morale cost is operational, not cultural
- The board case is stronger when you count what isn’t shipped
- A Defensible TCO Calculation Framework
- The nine-part model
- A simple break-even formula
- Evidence quality matters more than model complexity
- The Decision Framework When to Modernize vs Tolerate
- Modernize now
- Tolerate temporarily
- Don’t tolerate blindly
- The shortest path to action
Most legacy software total cost of ownership models are wrong before the spreadsheet is finished.
The most important benchmark in this discussion is brutal. Financial institutions underestimate legacy TCO by 70 to 80 percent, and actual IT costs average 3.4 times higher than initially budgeted, according to a 2024 Deloitte Banking Survey summarized by Digital Bank Expert. That gap isn’t a rounding error. It’s a governance failure.
CTOs usually don’t miss the obvious line items. They miss the compounding ones. Specialized labor. Integration glue. compliance fire drills. Downtime exposure. Product delays. Engineering attention diverted into keeping brittle systems alive. By the time finance sees the full picture, the organization has already normalized a budget shape that favors survival over change.
That’s why a serious TCO model has to do more than total invoices. It has to expose the difference between apparent cost and operating reality, then convert that gap into a modernization decision.
Why Your Legacy TCO Calculation Is Wrong by 70 Percent
Financial institutions that benchmark legacy environments against actual operating spend routinely find a gap large enough to distort capital planning. Earlier-cited audit data put the miss at 70 to 80 percent. That scale of error changes the decision, not just the spreadsheet.
The core problem is cost attribution. Standard TCO models capture the charges procurement owns, then leave engineering, security, compliance, and delivery teams to absorb the rest in separate budgets. A platform can therefore look stable and affordable in finance reviews while consuming far more labor, delay, and risk capacity than the asset register shows.
What the spreadsheet usually excludes
The omitted costs are usually real cash costs or measurable labor costs. They are booked elsewhere:
- Integration overhead booked inside project budgets rather than platform ownership
- Compliance remediation caused by platform limitations rather than new revenue or product work
- Internal support labor spread across engineering, operations, security, and service teams
- Delivery delays created by workarounds, manual controls, and brittle release paths
- Displaced modernization spend when maintenance demand crowds out replacement or replatforming work
This creates a second form of debt. The issue extends beyond technical debt into accounting debt.
Once costs are fragmented across departments, legacy assets appear cheaper than they are. Portfolio committees then compare a fully visible modernization program against an understated run-cost baseline. The incumbent system wins that comparison for the wrong reason.
Why this matters to a CTO
A TCO model that misses this much will bias investment decisions toward tolerance, even when the environment is already uneconomic. The result is predictable. Teams keep funding stability work, defer structural fixes, and call the outcome prudence.
Practical rule: If a system appears inexpensive only because its costs sit in infrastructure, security, compliance, and delivery budgets, the system is not low-cost. The organization is misallocating its true operating burden.
Consequently, many CTOs feel trapped by a budget that looks rational at review time but produces too little capacity for transformation. Until the cost model reflects where the labor, delay, and risk sit, the business will continue to treat modernization as discretionary spend instead of cost correction.
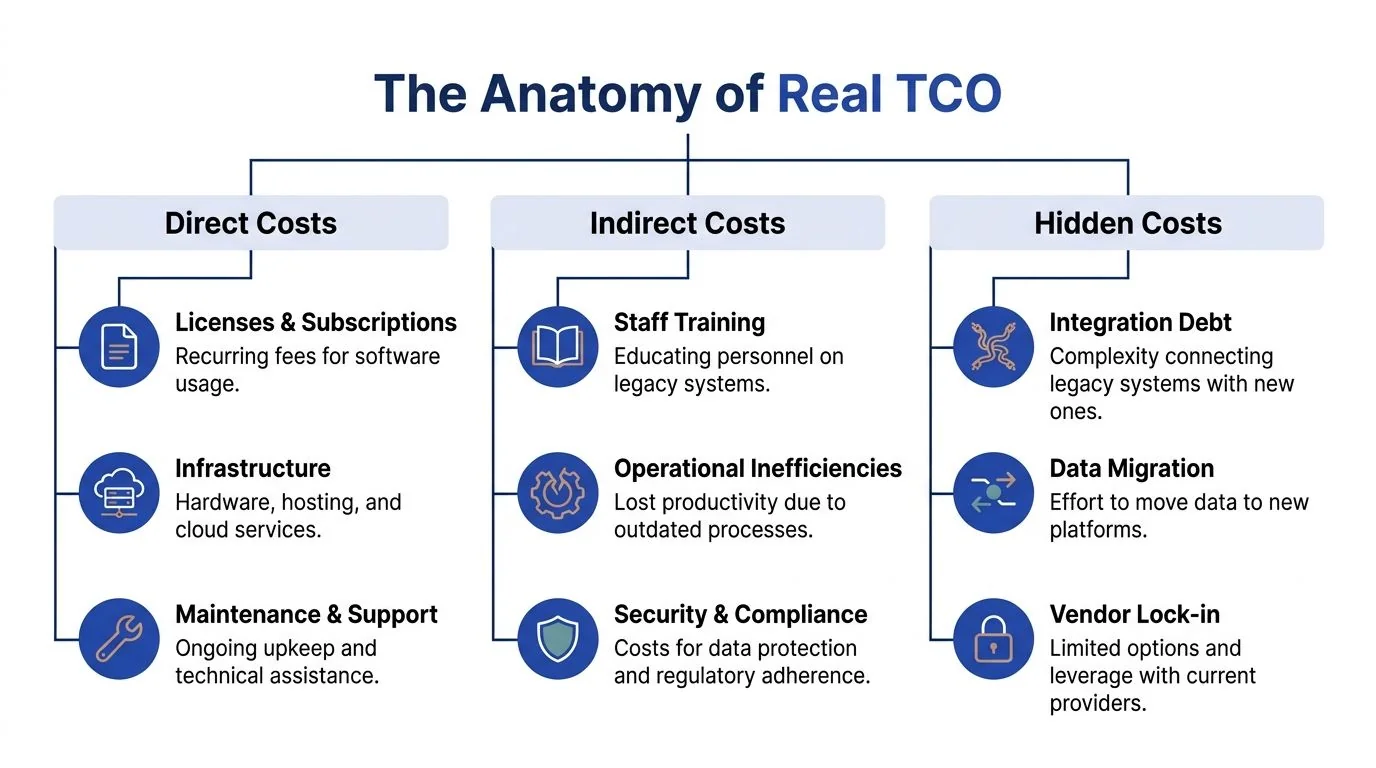
The Anatomy of Real TCO Beyond Obvious Costs
A real legacy software total cost of ownership model has three layers. Direct costs, indirect costs, and hidden business costs. Most internal reviews stop after the first layer.
The market benchmark is large enough to force attention. The average annual cost to operate and maintain one legacy enterprise system reaches $30 million globally, with cost drivers including specialized developer labor at $180 to $250 per hour and downtime that costs more than $300,000 per hour for over 90% of large enterprises, based on the benchmark summary published by NextOlive.
Direct costs that finance already sees
These are the easiest numbers to collect, and the easiest to over-trust.
| Cost Category | Type | Annual Cost Range (USD) | % of Total TCO (Avg.) |
|---|---|---|---|
| Specialized legacy developer labor | Direct | $300,000 to $1.4 million | Qualitatively high |
| Vendor extended support | Direct | $150,000 to $600,000 | Qualitatively material |
| Compliance remediation | Direct | $80,000 to $350,000 | Qualitatively material |
| Cybersecurity retrofits | Direct | $120,000 to $500,000 | Qualitatively material |
| Low-end annual system operating cost | Direct | $850,000 | Qualitatively variable |
| High-volume annual application operating cost | Direct | $3.2 million | Qualitatively variable |
These figures are useful, but they still don’t describe the full burden. A system can look manageable on direct spend and still destroy portfolio economics through downtime, delivery friction, and talent scarcity.
Indirect costs that engineering carries
Indirect cost is where legacy estates become deceptive.
- Downtime exposure often sits outside platform accounting, even though it is platform-driven.
- Manual workarounds consume team time but don’t appear as a system invoice.
- Cross-team coordination overhead rises when every release touches brittle dependencies.
- Knowledge concentration turns a small group of specialists into an operational bottleneck.
These aren’t soft costs. They’re real consumption of high-value engineering time.
A legacy system isn’t expensive only because it costs money. It’s expensive because it changes how every adjacent team has to work.
Hidden costs that distort strategic planning
The hidden layer is where boards and finance teams get misled.
| Cost Category | Type | Annual Cost Range (USD) | % of Total TCO (Avg.) |
|---|---|---|---|
| Downtime cost per hour | Hidden | $300,000+ per hour | Potentially dominant during incidents |
| Mid-market 3-year legacy SaaS TCO | Hidden or composite | $2.1 million to $3.8 million | Composite benchmark |
| Modernized 3-year comparator | Hidden or composite | $900,000 to $1.6 million | Comparator benchmark |
Use these as reference points, not as plug-and-play assumptions. The point isn’t that every system maps neatly to the benchmark. The point is that most internal models ignore these categories entirely, which makes the final number structurally unreliable.
For a CTO, the corrective action is simple. Treat every legacy platform as a mini business unit with its own labor market, compliance profile, failure exposure, and delivery drag. Anything less is a partial TCO, not a defensible one.
How Technical Debt and Integration Complexity Inflate TCO
Legacy cost doesn’t rise in a straight line. It rises because the architecture itself makes change expensive.
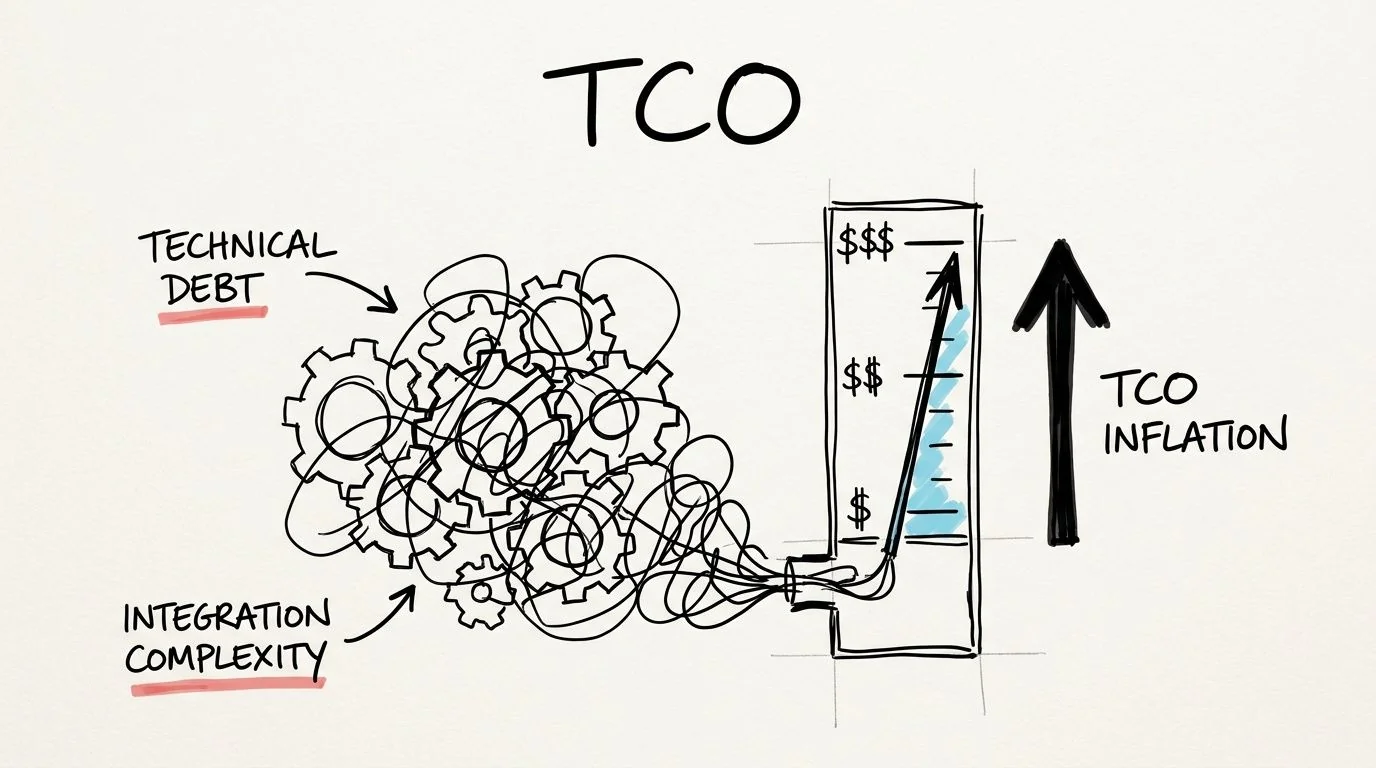
The cleanest benchmark on this point is from RecordPoint. Gartner projects technical debt will consume 40% of IT budgets by 2025, and in legacy environments that often shows up as an integration tax of 20 to 40 percent added to baseline maintenance costs when teams build custom APIs to connect old systems to modern platforms.
The cost multiplier is architecture
A monolith with undocumented dependencies doesn’t just cost more to maintain. It changes the economics of every future change:
- Security patching becomes regression testing across tightly coupled components
- Data access requires custom translation layers for modern analytics tools
- Workflow changes trigger side effects in adjacent modules that nobody wants to touch
- Cloud adoption turns into middleware sprawl instead of simplification
A key misstep in many modernization business cases occurs. Teams compare current maintenance spend to migration cost as if maintenance were stable. It isn’t. The baseline itself is inflating.
Integration debt is the hidden tax on every roadmap item
When a core legacy platform can’t expose clean services, every modernization initiative inherits the mess. The ERP upgrade, customer data platform, mobile app, fraud engine, and observability rollout all need custom connective tissue.
That’s why technical debt reduction has to be managed as an economic program, not a code-quality campaign. A practical resource on that front is this guide on how to reduce technical debt, especially if you’re trying to connect remediation work to platform budgeting and delivery outcomes.
Here’s a useful explainer on how this pattern shows up in real systems:
Why waiting makes the denominator worse
The hard part is that the architecture punishes delay.
Each year of deferral usually adds more point integrations, more exception handling, more undocumented business rules, and more dependence on scarce specialists. So even if the migration scope doesn’t expand dramatically, the environment around it becomes harder to unwind.
Board-level translation: Technical debt is not just deferred engineering cleanup. It is a recurring surcharge on every strategic initiative that touches the platform.
If you want a truer legacy software total cost of ownership model, don’t ask only what the system costs to run. Ask how much extra every adjacent program costs because this system still exists in its current form.
Quantifying Opportunity Costs and the Agility Tax
The largest legacy cost often isn’t the maintenance invoice. It’s the work your organization stops attempting because the platform makes it painful.
That’s the part most TCO models leave out. They measure spend, but not strategic delay. They capture vendor bills, but not the cost of slower launches, manual reconciliations, stalled integrations, and engineering attrition.
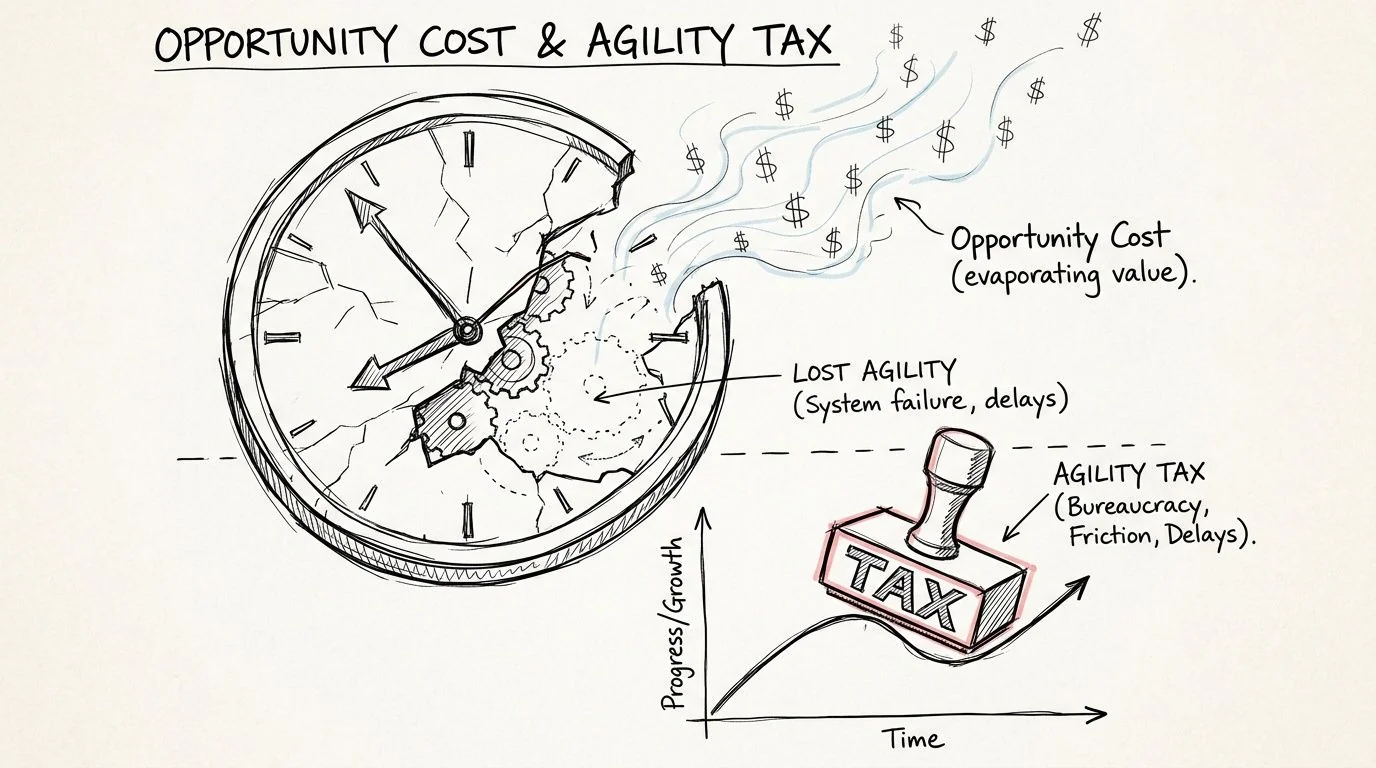
A useful benchmark comes from AlterSquare. It notes that the hidden opportunity costs of legacy software often outweigh direct expenses, and cites UK studies showing productivity losses equal to 14 hours per week per employee due to inefficient systems.
Agility loss shows up before finance sees it
CTOs usually see the symptoms long before the budget system does:
- Roadmaps shrink because teams avoid risky dependencies
- Product scope gets negotiated down to fit around brittle workflows
- Reporting remains manual because automated data movement is unreliable
- Business teams build side processes in email and spreadsheets to compensate
None of these line items appears under “legacy platform cost.” All of them are caused by it.
The morale cost is operational, not cultural
Leaders often treat staff frustration as a soft issue. That misses the operational point.
When engineers spend their best time maintaining fragile interfaces, working around missing self-service capabilities, or waiting on a few niche experts, the organization loses throughput and judgment quality. Senior people stop pushing for better architecture and start managing around constraints. Hiring gets harder because candidates can see the maintenance burden. Retention gets harder because strong engineers want to build systems with momentum.
Teams don’t just inherit old software. They inherit the habits required to survive it.
That matters because talent scarcity compounds platform risk. Once a few people become the only ones who understand how critical flows behave in production, your delivery model depends on continued institutional memory rather than sound engineering boundaries.
The board case is stronger when you count what isn’t shipped
A legacy platform that blocks pricing changes, customer-facing improvements, or analytics adoption imposes a tax on business responsiveness. That tax is often larger than the direct upkeep because it affects the whole portfolio rather than one application.
A CTO briefing should therefore include questions that standard TCO reviews omit:
| Opportunity cost area | What to inspect qualitatively |
|---|---|
| Feature delivery | Which roadmap items are repeatedly deferred due to platform constraints |
| Decision latency | Where reporting or reconciliations still depend on manual intervention |
| Talent risk | Which systems rely on a small number of specialists |
| Customer experience drag | Which service improvements are blocked by legacy integration limits |
If you can’t tie these bottlenecks to named systems, the TCO model is still too shallow. Opportunity cost becomes usable only when it is assigned to a platform and reviewed alongside direct operating spend.
A Defensible TCO Calculation Framework
Legacy TCO models routinely fail for a simple reason. They start with budget lines that are easy to export from finance systems, then stop before they capture the labor, delay, and control overhead visible in engineering, security, and product records. A model built that way is easy to present and hard to defend.
The fix is to treat TCO as an audit exercise, not a budgeting exercise. Every cost category should map to a named system, an accountable owner, and a traceable data source. If finance, platform engineering, security, and product cannot all see their costs represented, the output is not decision-grade.
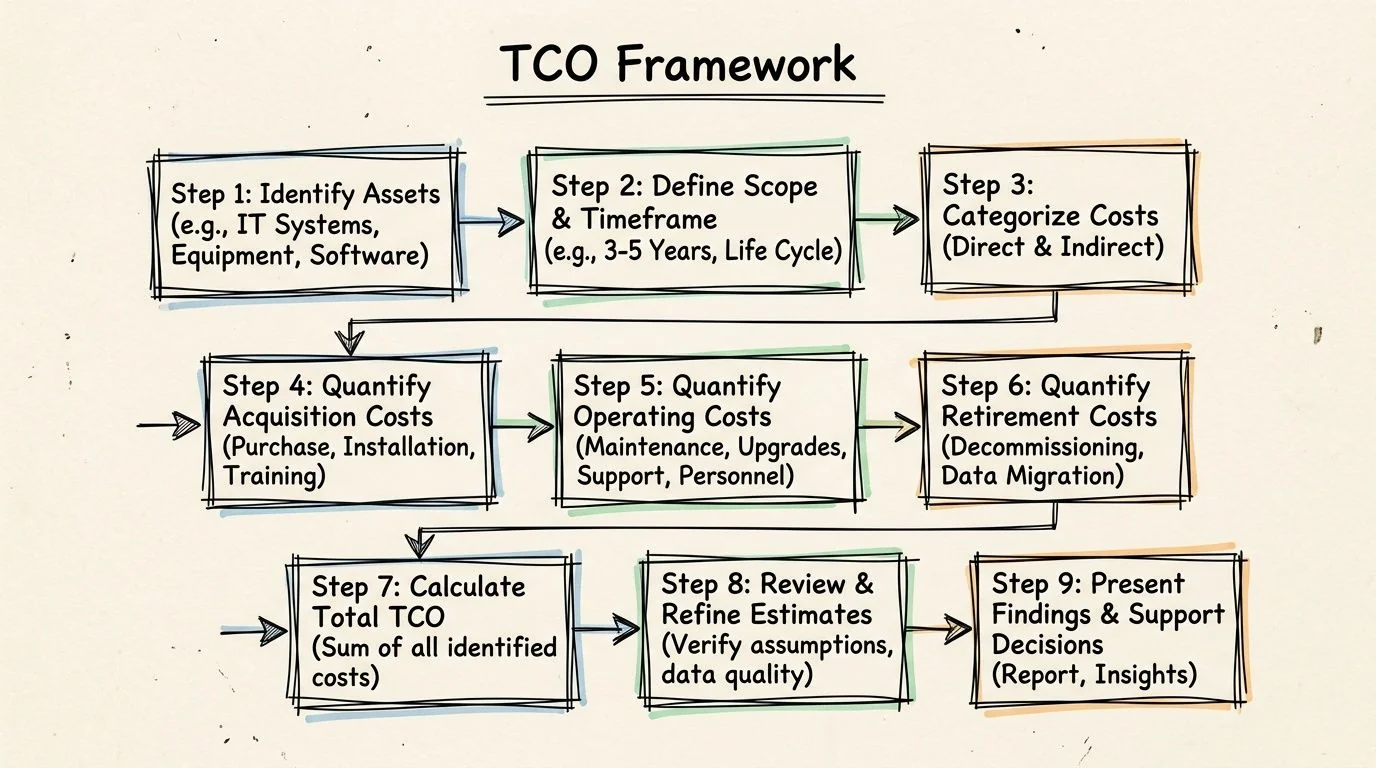
The nine-part model
-
Define the system boundary
Include the application, databases, batch jobs, middleware, reporting layers, interfaces, and operational tools required to run the service in production. -
Capture direct vendor and infrastructure spend
Consolidate licenses, support contracts, cloud or hosting charges, hardware, storage, backup, and non-production environments into one ledger. -
Measure specialist labor consumption
Count internal and external effort spent on support, patching, release coordination, incident response, operational checks, and environment maintenance. -
Assign integration overhead to the source system
Charge adapter builds, custom APIs, synchronization jobs, and reconciliation work back to the legacy platform that creates the dependency. -
Add compliance and security exception costs
Include compensating controls, exception reviews, manual evidence collection, policy workarounds, and extra tooling required to keep the platform within audit tolerance. -
Quantify downtime exposure
Estimate the business cost of outages, degraded performance, failed jobs, and slow recovery, using incident records and business impact assessments. -
Score delivery drag
Measure extra testing, redesign, release sequencing, and approval time caused by the platform. Tie those delays to actual backlog items rather than broad estimates. -
Model the modernization comparator
Estimate one-time transformation cost, transition risk, temporary parallel-run cost, and the expected steady-state operating profile after modernization. -
Calculate the break-even point
Compare cumulative run cost under both scenarios over time. The decision variable is not this year's spend. It is the cost curve.
A simple break-even formula
Use this structure:
Break-even point = Modernization one-time cost ÷ (Legacy annual TCO - Modern annual TCO)
The formula is straightforward. The discipline comes from what enters the annual TCO figure. If delivery drag, exception handling, or integration maintenance are left out, the break-even date shifts artificially into the future and the legacy platform looks cheaper than it is.
A useful operating rule is to tag each input as either booked, observed, or estimated. Booked costs come from finance. Observed costs come from tickets, incident reviews, sprint history, and audit logs. Estimated costs should be the minority and should carry an owner, date, and confidence rating. That simple classification makes weak assumptions visible before they distort the board case.
Evidence quality matters more than model complexity
Use named internal sources for each line item:
- Finance records for recurring spend and contract obligations
- Engineering time allocation from sprint history, support queues, and on-call records
- Incident reviews for outage burden and recovery effort
- Security and audit findings for exception handling and compensating controls
- Product delivery records for platform-linked delay
To make technical debt a concrete input for your model, this guide to a technical debt calculation formula helps translate backlog friction and remediation effort into a repeatable estimate.
For teams that want market context alongside internal numbers, Software Modernization Intelligence publishes partner, cost, and failure-pattern research across modernization approaches. Used correctly, external benchmark data is a calibration tool. It helps test internal assumptions, especially where system owners systematically under-assign integration and support costs.
If the financial case points toward change and the next question is execution path, this overview of legacy system modernization strategies is a practical reference.
Operational test: A TCO model is defensible only if finance, platform engineering, security, and product can review the same numbers and argue about assumptions rather than missing cost categories.
The Decision Framework When to Modernize vs Tolerate
A TCO number by itself doesn’t tell you what to do. The decision comes from thresholds, business criticality, and whether the cost is rising because the system is old or because the platform is strategically wrong.
The clearest trigger in the data is budget concentration. When legacy software maintenance consumes 60 to 80 percent of an organization’s total IT budget, modernization stops being discretionary. That pattern traps IT departments in a model where only 19 percent of resources go to innovation, as summarized by Aalpha.
Modernize now
Use immediate modernization planning when several of these conditions are true:
- Budget lock-up where legacy maintenance dominates the portfolio
- High business dependency on a platform that slows or blocks roadmap execution
- Specialist fragility where only a few people can safely operate the system
- Compliance strain that requires repeated exceptions, compensating controls, or manual evidence gathering
- Integration sprawl that turns every adjacent project into custom plumbing
If you need implementation pattern examples after the financial case is clear, this overview of legacy system modernization strategies is a useful reference point.
Tolerate temporarily
Some systems should be tolerated for a period, not transformed immediately.
That usually applies when the platform is stable, low-change, and peripheral to competitive differentiation. It also applies when the system’s risk is known, contained, and not driving cross-portfolio complexity. In those cases, the right move isn’t denial. It’s managed tolerance with explicit controls, named owners, and a sunset review date.
Don’t tolerate blindly
Tolerance fails when leaders call it a strategy but don’t impose governance. A tolerated legacy platform still needs:
- A risk register tied to concrete operational failure modes
- A staffing plan for specialist dependency
- An integration policy that prevents uncontrolled sprawl
- A review cadence that tests whether the assumptions still hold
A structured legacy system risk assessment becomes useful. It forces the organization to separate “stable for now” from “accumulating operational risk.”
The shortest path to action
For most CTOs, the next moves are straightforward:
- Run a deep TCO audit on the systems that absorb the most support effort and cross-team coordination.
- Rank the top three cost drivers by complete TCO, not invoice spend.
- Model one modernization case within a three-year view using direct cost, integration burden, compliance effort, and opportunity cost.
- Decide system by system whether to modernize now, tolerate under governance, or isolate and decommission later.
The non-obvious conclusion is this. Legacy software total cost of ownership isn’t mainly an accounting problem. It’s a portfolio truth problem. Once you assign the hidden costs back to the platforms creating them, many “too expensive to modernize” systems turn out to be too expensive to keep.
If your current model only counts licenses, support, and hardware, you don’t have a TCO view. You have a partial invoice summary. The corrective step is to rebuild the number around labor, integration, compliance, downtime, and lost delivery capacity. That’s the version a board can trust, and the only version a CTO should use to decide whether a legacy system stays, changes, or goes.
Chief Analyst, Software Modernization Intelligence · 10+ years B2B market research
Published: ·Updated: