A CTO's Guide to Legacy System Risk Assessment
A practical legacy system risk assessment framework to quantify technical debt, model real costs, and make defensible modernization decisions.
On this page
- Overview
- The Financial Impact of Inaction
- Top Reasons for Modernization Delay
- The Four Pillars of Legacy System Risk
- Building a Defensible Risk Scoring Framework
- Gathering Verifiable Evidence
- Creating the Risk Matrix
- 1. Probability of Failure (How Likely Is It to Break?)
- 2. Business Impact (How Bad Is It When It Breaks?)
- How to Calculate the True Cost of Technical Debt
- Quantifying Direct Costs
- Measuring Indirect and Opportunity Costs
- Legacy System Total Cost of Ownership Template
- Evaluating Your Modernization Pathways
- Deconstructing the Primary Modernization Options
- Choosing a Pathway Based on Risk and Business Goals
- Vetting Your Implementation Partner
- When Not to Modernize Your Legacy System
- The Stability Versus Stagnation Calculation
- Scenarios Where Deferring Is Defensible
- Legacy System Risk Assessment FAQ
- How Do I Start a Risk Assessment with Poor Documentation?
- What Technical Metrics Actually Matter for Legacy Risk?
- How Should I Present These Findings to the Board?
A legacy system risk assessment is a financial and operational stress test for your most critical and often most fragile systems, not an IT audit. It translates ambiguous technical issues into specific business liabilities and gives you the data to justify modernization or targeted remediation.
The Financial Impact of Inaction
Deferring modernization on a legacy system is a high-risk decision presented as fiscal prudence. The conversation often stalls on "if it ain't broke, don't fix it," which ignores the compounding interest on technical debt.
The relevant question is the system's escalating liability tomorrow, not whether it functions today.
A recent legacy modernization survey from Saritasa.com of over 500 U.S. IT professionals found that 62% of organizations continue to operate outdated software despite known risks. The primary concerns cited were security vulnerabilities (43%) and high maintenance costs (39%). Yet 50% of these organizations delay upgrades because the system "still works," a justification that often precedes a major failure.
IT leaders frequently encounter a standard set of arguments for delaying modernization projects. Knowing these obstacles lets you answer them with data.
Top Reasons for Modernization Delay
This table lists the most common justifications for delaying modernization in the survey above, so you can anticipate internal objections. It is a vendor-run survey of U.S. IT professionals, so read it as directional.
| Reason for Delay | Share of Respondents (Saritasa survey) |
|---|---|
| The current system is still functional | 50% |
| Budget limitations | 44% |
| Fear of disrupting operations | 38% |
| Data migration concerns | 35% |
| Lack of internal support for modernization | 30% |
| Lack of clear ROI | 25% |
These figures show a disconnect between the perceived safety of the status quo and the quantifiable risk of inaction. A risk assessment closes that gap with objective data.
The Four Pillars of Legacy System Risk
A proper assessment replaces vague warnings with measurable factors and turns a technical problem into a quantifiable business liability. Four pillars of risk cover it.
- Technical Fragility: This measures the system's brittleness and resistance to change. Indicators include high cyclomatic complexity, zero automated test coverage, and a shrinking pool of engineers proficient in the language (e.g., COBOL, FORTRAN). Each minor code modification becomes a high-risk event.
- Operational Bottlenecks: Legacy systems inhibit agility. They often rely on manual batch processes, lack modern APIs for integration, and create data silos that prevent real-time decision-making. These bottlenecks directly impact time-to-market for new products and features.
- Security Vulnerabilities: Legacy systems present a large attack surface. Unsupported operating systems, unpatched libraries, and outdated encryption protocols are common entry points for security breaches. Verizon's Data Breach Investigations Report consistently shows that attackers favor exploiting known, unpatched vulnerabilities.
- Vendor Viability: Your risk profile is directly linked to your vendor's stability. If the company supporting your legacy hardware is acquired, changes its business model, or ceases operations, you could be left with an unsupported, unserviceable system.
A legacy system risk assessment gives leadership hard data. You are presenting a financial model of an unaddressed business liability, not requesting a budget to fix old code.
By assigning quantitative values to each of these pillars, you build a defensible case. The goal is to shift the conversation from "this system is old" to "this system carries a $2.3M annual risk due to potential downtime, security breaches, and compliance fines." That level of clarity pushes a decision before a crisis does.
Building a Defensible Risk Scoring Framework
Stating a legacy system is "high-risk" without data is an opinion. Opinions do not secure modernization budgets.
To gain traction, you need a data-driven framework that translates technical fragility into probability and impact. Without it, budget requests rest on conjecture and are likely to be treated that way.
The first step is to map critical business processes directly to the legacy components that support them to understand the blast radius. If your mainframe-based payment processor fails, does it halt $50,000 in transactions per hour, or does it delay an internal report with low readership? Answering this question separates the merely old from the actively dangerous.
The flowchart shows how technical weakness cascades into business impact.
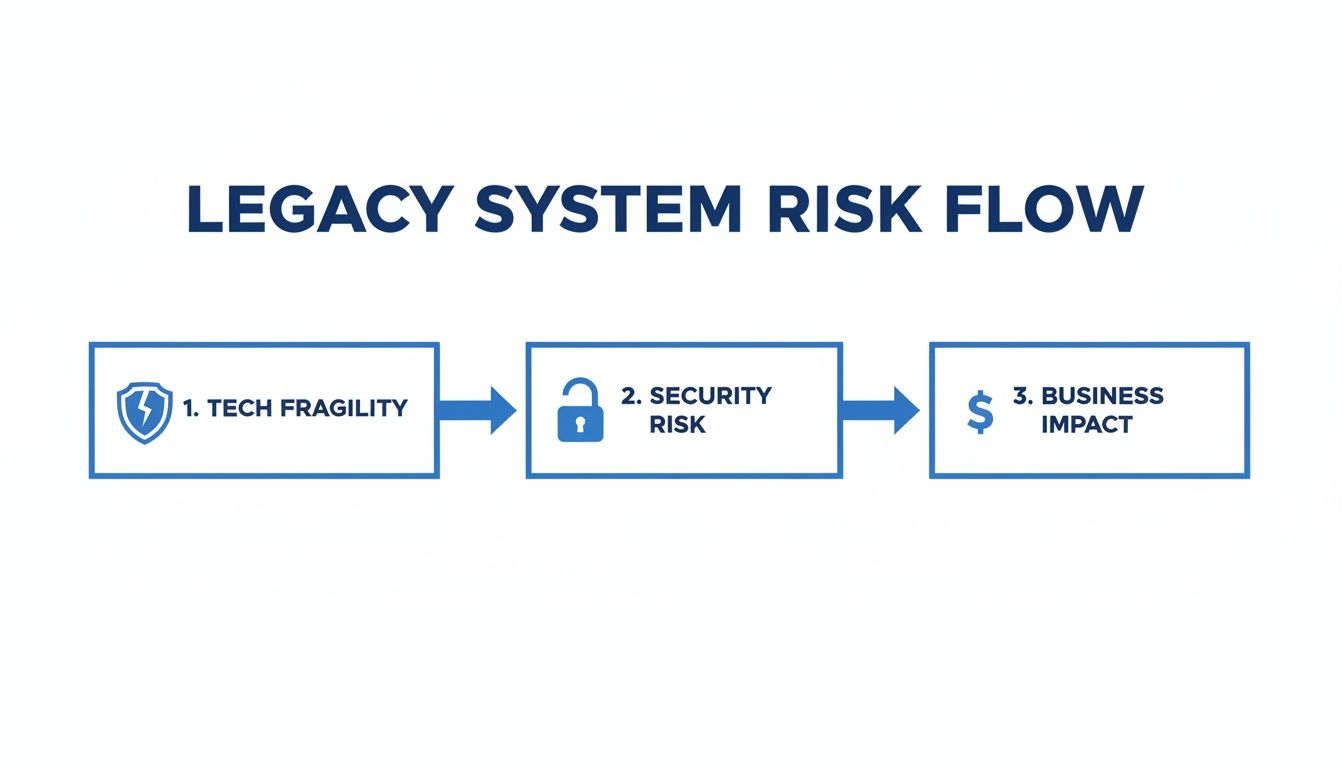
Fragile code creates security vulnerabilities, which can lead to direct financial loss. Technical debt is a balance sheet liability as well as an engineering problem.
Gathering Verifiable Evidence
Once critical systems are identified, you must collect objective evidence. The goal is an objective case file on each system's health, combining quantitative data and qualitative input.
Begin with system logs and incident reports. Metrics like Mean Time Between Failures (MTBF) and Mean Time To Recovery (MTTR) provide a baseline for stability. A system that fails weekly, even with rapid recovery, represents a significant operational drain and indicates deeper issues.
Next, use static analysis tools to look for objective indicators of fragility. A high cyclomatic complexity score is a direct predictor of how difficult a module will be to modify without introducing new defects. Similarly, high code churn—frequent changes to the same files—is a strong indicator of a poorly understood and unstable part of the codebase.
Finally, interview veteran engineers to access the "tribal knowledge" not found in formal documentation. Ask specific questions:
- "Which part of this system do you avoid modifying, and why?"
- "What manual workarounds are required to keep this system operational?"
- "If the original developer were unavailable, could we realistically support this system?"
Do not skip these conversations. The greatest risk, such as a critical process understood by only one person, will never appear in an automated scan.
Creating the Risk Matrix
The core of your assessment is a risk matrix. This tool evaluates systems along two independent axes: Probability of Failure and Business Impact. That distinguishes a low-impact but unreliable system from a high-impact, moderately stable one.
1. Probability of Failure (How Likely Is It to Break?)
This is a composite score based on tangible factors, not a subjective impression:
- Skill Scarcity: Is the system written in COBOL, with the only two proficient developers nearing retirement? That is a high probability of failure in supportability.
- Code Complexity: Use data from static analysis tools for an objective measure.
- Test Coverage: A critical system with less than 10% unit test coverage presents a high risk of regression with every deployment.
- Vendor Support: Is the hardware or software End-of-Life (EOL)? That is a certain failure point; only the timeline is unknown.
2. Business Impact (How Bad Is It When It Breaks?)
This is where you translate technical issues into financial terms.
- Revenue Loss: Calculate the direct revenue impact per hour of downtime. The CFO will pay attention to this metric.
- Compliance Fines: What are the potential fines (GDPR, HIPAA, etc.) if this system fails and results in a data breach?
- Reputational Damage: How many customers are likely to be lost? What is the estimated PR cost?
- Operational Halt: What percentage of the business ceases to function if this system is down?
Plot every legacy component on this matrix. Anything in the top-right quadrant (high probability, high impact) becomes a P0 modernization candidate. A single slide showing this matrix works better with the board than a 50-page technical document.
As you plan decommissioning, remember that data management is part of the risk framework. Adherence to standards like NIST SP 800-88: The Authoritative Guide to Secure Data Sanitization is not optional; it keeps retiring old risks from creating new ones.
How to Calculate the True Cost of Technical Debt
Technical debt is a financial liability, not an abstract engineering concept. To make the case for modernization, move from discussing "messy code" to presenting a financial model. The analysis must go beyond maintenance headcounts to the total economic drag the legacy system imposes on the business.
The U.S. Government Accountability Office reports that federal agencies have typically reported spending about 80% of their IT budgets on operating and maintaining existing systems, including legacy systems, rather than on new development. That figure is specific to U.S. federal agencies, so do not assume your own ratio. Measure it. Those are the explicit expenses; the larger damage often comes from indirect costs.
Quantifying Direct Costs
Direct costs are the most straightforward to track but are frequently underestimated. The analysis must include specialized labor and unsupported hardware.
- Talent Scarcity: Sourcing qualified COBOL or FORTRAN developers is difficult. These specialists often command premium contract rates because the available talent pool is limited.
- Unsupported Hardware: When a vendor designates hardware as End-of-Life (EOL), you must either pay high fees for third-party extended support or operate without it, where a single failure could cause prolonged downtime.
- License & Maintenance Fees: Legacy software vendors can increase annual maintenance and licensing fees with little justification, leveraging the high cost of migration as a deterrent to switching.
These costs drain the budget predictably and increasingly.
A clear real-world example is the U.S. federal government. GAO's 2019 review identified 10 critical legacy systems that together cost about $337 million a year to operate and maintain. GAO's 2025 follow-up, as reported by FedScoop, found that only three of those modernization projects had been completed; the remaining seven systems range from 23 to 59 years old and still cost hundreds of millions of dollars a year to operate. Even large budgets do not easily solve entrenched tech debt.
Measuring Indirect and Opportunity Costs
Indirect costs are the business value you fail to capture because of technological constraints, and they are often the largest financial damage a legacy system does. CFOs and boards respond to this argument.
The most expensive part of a legacy system is not the cost to maintain it; it is the revenue lost because it prevents you from competing effectively.
Key indirect costs to model include:
- Slow Time-to-Market: If a simple feature change requires a six-month development and testing cycle due to system fragility, you are ceding market share to more agile competitors. Quantify this by calculating the revenue lost from a new product launch delayed by two quarters.
- Poor Performance & Customer Churn: Legacy systems can struggle with modern workloads, leading to slow response times and outages. Akamai's 2017 retail performance study found that a 100-millisecond delay in website load time can hurt conversion rates by up to 7% for the retailers it studied. That is retail data from 2017 and does not transfer directly to your business, but the mechanism is real and measurable on your own traffic.
- Integration Friction: A legacy system without modern APIs creates data silos and forces manual, error-prone workarounds. This cost is measured in wasted engineering hours and poor business intelligence.
To consolidate this information, a structured Total Cost of Ownership (TCO) calculation is necessary. This replaces anecdotal complaints with a financial number that justifies action.
Legacy System Total Cost of Ownership Template
This template provides a framework for capturing all hidden expenses tied to a legacy system. Use it to build the financial case for modernization.
| Cost Category | Description | Example Metric | Annual Cost ($) |
|---|---|---|---|
| Direct Costs | |||
| Hardware Maintenance | Servers, storage, networking gear, extended support for EOL hardware. | Annual support contracts, replacement parts budget. | |
| Software Licensing | Annual license fees, maintenance contracts from legacy vendors. | Vendor invoices, annual contract escalations. | |
| Specialized Talent | Cost to retain or contract developers for obsolete languages (COBOL, FORTRAN). | Premium contractor rates, internal retention bonuses. | |
| Infrastructure | Data center space, power, cooling, physical security. | Monthly data center co-location bills. | |
| Indirect Costs | |||
| Slow Time-to-Market | Delayed revenue from features that competitors launch faster. | (Revenue of New Feature / 12) * Months Delayed. | |
| Developer Inefficiency | Extra hours spent on manual deployments, bug fixing, and workarounds. | (Avg. Engineer Salary) * (% Time on Legacy) * (Headcount). | |
| Integration Overhead | Manual data entry and custom scripts needed to connect to modern systems. | Hours spent by data analysts on manual data pulls. | |
| Opportunity Costs | |||
| Customer Churn | Lost customers due to poor performance, downtime, or lack of modern features. | (Avg. Customer Lifetime Value) * (Churn Rate %). | |
| Missed Market Share | Inability to enter new markets or launch new products due to system limitations. | Estimated revenue from a product you can't build. | |
| Brand Damage | Negative perception from system outages or security breaches. | Estimated impact on new customer acquisition. |
Completing this template turns vague technical complaints into a defensible number. For more guidance, review a detailed technical debt calculation formula.
Evaluating Your Modernization Pathways
After quantifying the risk, the conversation shifts from if to how to modernize. Selecting a path has significant financial and operational consequences, and many companies get it wrong.
Many legacy modernization projects are initiated but never completed, often due to a disconnect between business goals and IT execution. Fear of change and cost overruns are also major factors, and approved budgets are often cut below what was requested.
These failures usually reflect the wrong strategy or implementation partner rather than a flaw in modernization itself.
Deconstructing the Primary Modernization Options
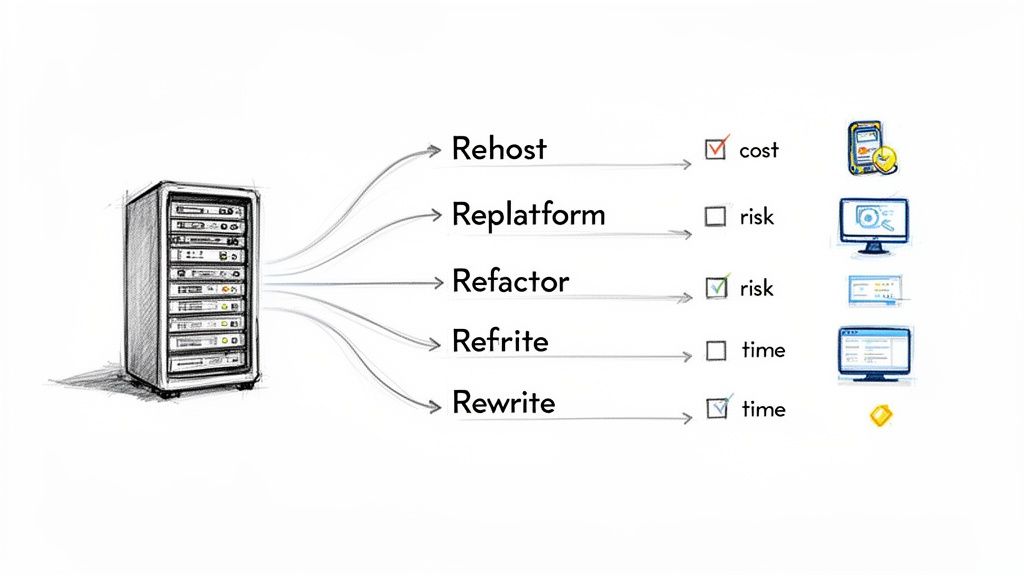
Once the risks are understood, exploring application modernization strategies is the next step. Most options fall into one of four categories, each with a distinct risk-reward profile.
- Rehosting (Lift and Shift): The fastest and lowest-cost option. The application is moved as-is to cloud infrastructure (IaaS). This immediately mitigates the risk of on-premise hardware failure but does not address underlying technical debt within the application.
- Replatforming (Lift and Reshape): A moderate approach. The core architecture remains, but specific components are replaced with cloud-native services (e.g., moving a local SQL Server database to Amazon RDS). This provides some cloud benefits without a full rewrite but can introduce new integration complexities.
- Refactoring: Targeted modification of the existing codebase to improve design and reduce technical debt without changing external behavior. This is often a precursor to a larger rewrite, allowing stabilization of the most fragile modules first.
- Rewriting (or Re-architecting): The most intensive option. The application is rebuilt from scratch using modern languages and architectures (e.g., microservices). This offers the greatest long-term value but carries the highest cost and risk of failure.
The optimal path is the one that delivers the most risk reduction for an acceptable cost and level of disruption. A rapid "lift and shift" to get off failing hardware is a better business decision than a three-year rewrite that never finishes.
Choosing a Pathway Based on Risk and Business Goals
Do not let a vendor's preferred solution dictate your strategy. The choice should follow from your risk assessment.
| Modernization Pathway | Best For… | Primary Risk Mitigated | Key Consideration |
|---|---|---|---|
| Rehosting | Speed and tight budget constraints. | Hardware EOL & Data Center Risk: Immediately gets you off aging, unsupported hardware. | Does not fix underlying code fragility or talent scarcity issues. |
| Replatforming | Gaining specific cloud benefits without a full rewrite. | Vendor Lock-in & Scalability: Swaps proprietary components for managed services. | Can create integration challenges between old and new components. |
| Refactoring | Systems with high business value but isolated areas of high technical debt. | Code Fragility & High Churn: Fixes the most unstable modules without boiling the ocean. | Requires deep system knowledge to avoid introducing regressions. |
| Rewriting | Mission-critical systems that are a direct bottleneck to business growth. | Operational Bottlenecks & Lack of Agility: Unlocks new features and scalability. | Highest risk of budget overruns and project failure. |
A pragmatic strategy might involve rehosting a critical system to immediately de-risk the hardware, followed by a methodical refactoring or rewriting of modules over the next 18-24 months. For a deeper look at this first step, see our cloud migration risk assessment.
Vetting Your Implementation Partner
The partner matters more than the cloud platform. An incompetent vendor can derail a well-conceived modernization plan.
Demand transparent pricing. A vague "six-figure engagement" is a red flag. For a COBOL to Java migration, for example, request a per-line-of-code (LOC) cost range. A reputable specialist should be able to provide an estimate and explain exactly what it covers (conversion only, or conversion plus testing and cutover), since quoted rates vary widely with complexity.
Scrutinize their direct experience with your specific technology stack. A vendor claiming to be a "modernization expert" with no case studies migrating a mainframe banking application similar to yours lacks credible experience. Request references and contact them.
Ask pointed questions:
- What was the final budget versus the initial quote?
- What was the most significant unexpected technical challenge encountered?
- How did your team handle it?
Finally, listen for what they advise against. A true partner will identify when a full rewrite is a poor decision or when a simpler solution is more appropriate. A vendor that only proposes its most expensive, comprehensive service is a liability, not a partner.
When Not to Modernize Your Legacy System
Modernization is often presented as the default, responsible path, but that assumption can be wrong. After a rigorous risk assessment, the right conclusion can be to do nothing.
Choosing to maintain a legacy system can be a calculated business decision, not an avoidance of work. It makes sense when the cost, disruption, and risk of a migration project significantly outweigh any potential benefits.
Pursuing modernization for its own sake is a common error. It can consume millions in budget and engineering resources on a project with no meaningful business impact. The goal is to manage risk and enable growth, not to have the newest technology stack. Sometimes, that means leaving a stable, predictable system in place and allocating resources to problems that directly affect customers.
The Stability Versus Stagnation Calculation
The core question is whether the system is a stable asset or an active liability.
An application may be old, but if it has operated without major incidents for a decade, it has a proven track record of reliability. Replacing it introduces implementation risk—the danger that the new system will be less reliable than the one it replaced.
This is particularly true for systems with low business impact but high technical complexity. Consider an internal reporting tool used by one department quarterly. An outage is an inconvenience, not a catastrophe. If that tool is deeply integrated into a complex mainframe architecture, a migration could cost a large sum and occupy senior engineers for months.
The risk in this scenario is the opportunity cost of assigning your best engineers to a project that creates no value, not the old system failing. That talent could be developing a new product line or improving the performance of your checkout process.
Scenarios Where Deferring Is Defensible
The decision not to modernize requires the same rigor and data as a decision to approve a project. Your risk assessment must identify the conditions where deferral is the most prudent course.
Look for these indicators:
- Extremely Low Business Criticality: The system does not support a core revenue stream or critical operational process. A failure is an inconvenience, not a crisis.
- Zero Planned Functional Changes: The business has no roadmap for this application. Its feature set is frozen.
- Complete Loss of Tribal Knowledge: The original developers are unavailable, documentation is nonexistent, and no one on the current team fully understands its internal logic. A rewrite would be a high-risk reverse-engineering project.
- Prohibitive Migration Complexity: The system has a web of undocumented dependencies or relies on proprietary hardware that is difficult to replicate in the cloud. This is common; learn more about these mainframe to cloud migration challenges.
When these indicators are present, the project risk is far higher than the operational risk of inaction.
In these cases, the responsible decision is to accept the system, secure its perimeter, and place it on a minimal "keep the lights on" maintenance plan. This frees up budget and key personnel for initiatives that drive business value.
Legacy System Risk Assessment FAQ
The most frequent questions about assessing legacy technology are answered below.
How Do I Start a Risk Assessment with Poor Documentation?
When formal documentation is missing or outdated, your primary sources of truth become the people and the system itself.
Begin by interviewing veteran engineers and business users to capture their "tribal knowledge." This is your de facto documentation, containing the unwritten rules, manual workarounds, and implicit dependencies.
Concurrently, deploy application discovery and monitoring tools. These map the system as it operates today, tracing API calls, data flows, and hidden connections. This gives you a current picture of the system, not an idealized diagram from 2003.
Finally, analyze your incident and support ticket history. This data will identify the most fragile modules and recurring failure points. This combination of human intelligence and system data is sufficient to build your assessment, even without formal documentation.
What Technical Metrics Actually Matter for Legacy Risk?
A few key indicators give most of the signal needed to assess a system's fragility and maintenance overhead.
Focus on these metrics:
- Cyclomatic Complexity: This measures code entanglement. A high score indicates that the code is difficult to test and modify without introducing regressions.
- Code Churn: Constant patching of the same files, especially for non-feature work, indicates an unstable part of the codebase.
- Mean Time Between Failures (MTBF): This metric, derived from production logs, provides an objective measure of system stability.
- Lack of Test Coverage: A low percentage of automated test coverage is a direct measure of risk, as every change has a high probability of causing a regression.
- Dependency Age: Track how many libraries are past their end-of-life (EOL) date. Verizon’s breach reports consistently show that exploiting known vulnerabilities in unpatched software is a primary attack vector.
Use these data points to justify your risk scores to non-technical stakeholders.
How Should I Present These Findings to the Board?
Translate technical risk into business impact. The board cares about revenue, competitive threats, and liability, not cyclomatic complexity.
Structure your presentation around three themes:
- Financial Risk: Use the TCO analysis from your assessment to show escalating maintenance costs. More importantly, quantify the potential revenue loss from a major failure. "This system processes $1.2M per hour, and our incident history and monitoring data indicate a critical failure is likely within 18 months" (an example, using your own figures) lands harder than discussing outdated code.
- Competitive Risk: Articulate how the legacy system constrains the business. Connect slow development cycles on the platform to the new products you cannot launch. Show how more agile competitors are gaining market share.
- Security and Compliance Risk: Be specific. Name the known vulnerabilities (CVEs) in your EOL components. Then, quantify the potential fine for a data breach or non-compliance in your industry. Assign a dollar amount to the threat.
Your risk matrix is the most important slide. It puts the analysis in one chart, showing the board where the highest risks lie and why the systems in the top-right quadrant require immediate attention.
This approach turns a technical request into a business conversation, which is what secures budget and executive support.
At Software Modernization Intelligence, we believe a successful modernization starts with de-risking your vendor selection. The site provides scoping cost ranges, common failure points, and source-linked vendor capability evidence to support a defensible choice. Get your vendor shortlist without the sales pitches. Learn more.
Chief Analyst, Software Modernization Intelligence · 10+ years B2B market research
Published: