
A Guide to Mainframe Application Portfolio Analysis
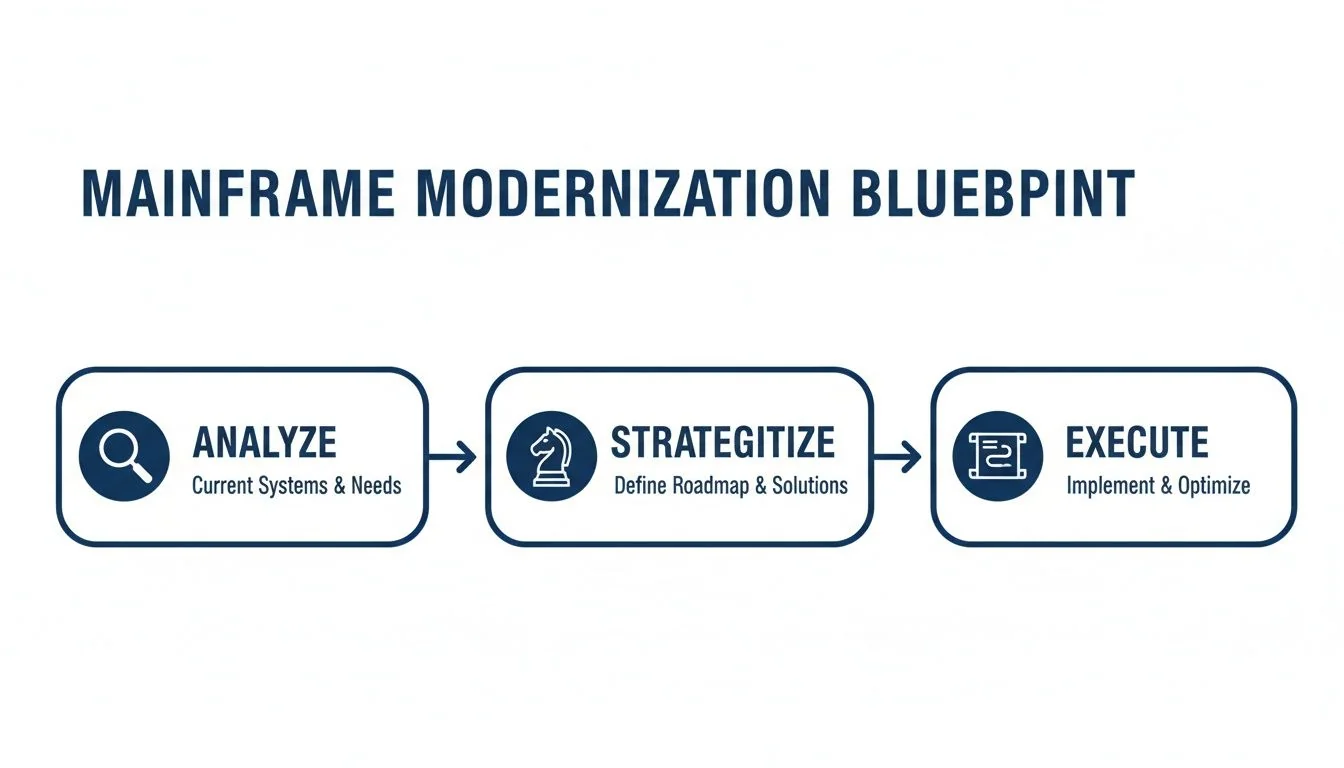
Mainframe application portfolio analysis is the data-driven process for deciding which applications to migrate, rewrite, retain, or retire. It replaces executive guesswork with a quantitative framework, preventing the 30-50% budget overruns that plague modernization projects. This analysis provides a defensible roadmap for moving off z/OS or VSE systems, aligning technical execution with strategic goals.
Too many organizations jump into rehosting or rewriting without a complete map of their legacy estate, leading to operational chaos and blown budgets. A proper portfolio analysis is the foundational blueprint that prevents this failure, ensuring resources are focused on high-impact initiatives.
The Four Pillars of Mainframe Portfolio Analysis
A robust analysis evaluates every application against four pillars. This framework is non-negotiable for building a strategy that delivers measurable business outcomes, moving you from unknown risk to calculated execution.
| Pillar | Key Question | Primary Metrics |
|---|---|---|
| Technical Debt | How complex, fragile, and difficult is this application to maintain and enhance? | Code complexity scores (e.g., cyclomatic), language obscurity (Assembler vs. COBOL), lack of documentation, test coverage gaps, and developer skill availability. |
| Business Value | How critical is this application to revenue, operations, and strategic goals? | Revenue generated or supported, customer-facing impact, regulatory compliance necessity, and alignment with future business initiatives. |
| Operational Risk | What is the operational cost and stability risk of keeping this application on the mainframe? | MIPS consumption, batch window failures, unplanned downtime incidents, and security vulnerabilities. |
| Modernization ROI | What is the expected financial and strategic return from modernizing this application? | Projected cloud hosting savings, license cost reductions, increased development velocity, and new market opportunities unlocked. |
An application with high business value but low technical risk has a negative modernization ROI. Conversely, a low-value application consuming enormous MIPS with high maintenance costs is a prime candidate for retirement, freeing up budget for strategic projects. This analysis builds a defensible business case that justifies the investment in migration and aligns with broader digital transformation best practices.
Creating the Application Inventory and Dependency Map
A successful modernization begins with a data-driven map of your application ecosystem. Manual review of millions of lines of COBOL, PL/I, JCL, and Assembler is a guaranteed failure. You need automated discovery tools to parse code, identify dead programs, and expose the tangled interdependencies that run your business.
Quantifying the Technical Landscape
The discovery phase must capture a specific set of metrics for every application. This data is the bedrock for scoring technical debt, estimating costs, and building a credible business case.
Your inventory must capture these critical data points:
- Code Volume and Language: Document the lines of code (LOC) for each program and categorize it by language. This directly informs refactoring or rewrite effort.
- Processing Consumption: Capture MIPS or MSU consumption for online transactions and batch jobs to identify the most expensive applications.
- Data Dependencies: Map every call to databases (DB2, IMS) and file systems (VSAM), noting the access type (read/write). This is critical for grouping applications for migration.
- Batch Job Integration: Detail all batch job schedules, dependencies, and their Service Level Agreements (SLAs). A single delayed job can trigger a catastrophic chain reaction.
- External Connections: Pinpoint every external API call, screen scraping interface, and file transfer. These integration points are the most common points of failure during modernization.
The most common failure is underestimating application interdependencies. Multi-million dollar projects derail because a “simple” change breaks a critical, undocumented batch process. Automated dependency mapping is the only insurance against this blast radius. A rigorous legacy assessment process turns these insights into a concrete plan.
Visualizing the Ecosystem
A dependency graph is an essential tool for explaining complexity and risk to both technical and business stakeholders. This visual map reveals logical “application clusters”—groups of programs sharing data or tight transactional dependencies. For instance, a graph showing ten applications writing to the same core DB2 customer table proves they are a tightly-coupled unit that must be modernized together. These clusters, not individual applications, become the real units of modernization, dramatically reducing project risk.
Scoring Technical Debt and Business Value
With a complete inventory, the next step is to replace subjective opinion with objective, data-driven scores for technical debt and business value. This is how you build a defensible roadmap that the CFO and business leaders will approve.
Quantifying Technical Debt
A technical debt score quantifies the fragility and maintenance burden of each application. This is a composite metric based on concrete factors, not guesswork.
The technical debt scorecard must include:
- Code Complexity: Use an automated tool to measure the cyclomatic complexity of COBOL and PL/I programs. A score over 20 signals convoluted logic that is a nightmare to test and modify.
- Language Obscurity: An application in Assembler has a higher debt score than one in modern COBOL because the pool of skilled developers is nonexistent.
- Knowledge Gaps: If documentation is nonexistent and expertise is locked in the head of a single developer nearing retirement, the debt score is extreme.
- Skill Set Availability: An application relying on a niche technology like Natural/Adabas is a liability if you cannot hire or retain talent.
This scoring exercise provides the data needed to effectively manage technical debt and prioritize which fires to extinguish first.
Measuring Business Value
In parallel, you must work with business leaders to translate strategic goals into a quantifiable score for each application. This prevents the common failure of spending millions to modernize a technically interesting application with zero commercial impact.
The business value framework scores applications on their contribution to the company’s bottom line:
- Revenue Impact: Does the application directly generate revenue? A core billing system is infinitely more valuable than a departmental reporting tool.
- Customer-Facing Functionality: Applications that customers interact with, like an online portal, have enormous value. A poor experience directly impacts brand perception and retention.
- Regulatory and Compliance Mandates: Systems required for financial reporting are non-negotiable. They have high intrinsic value because turning them off means fines or worse.
- Strategic Alignment: If a legacy system is the bottleneck preventing a new digital product launch, its strategic value to modernize is immense.
The Portfolio Analysis Matrix
The output of this scoring is a 2x2 matrix plotting every application on two axes: Technical Debt and Business Value. This visual provides immediate, data-driven clarity on the required action.
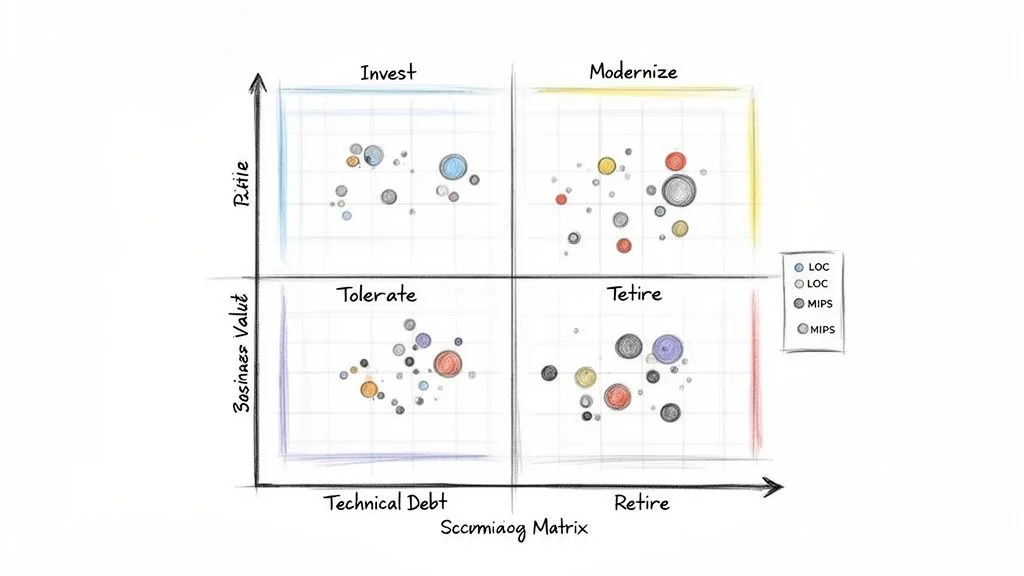
Each quadrant dictates a clear strategy:
- Invest (High Value, Low Debt): Your crown jewels. Protect and enhance them on the mainframe with APIs and incremental updates.
- Modernize (High Value, High Debt): Top migration priorities. These are critical to the business but are technical time bombs. This is where you focus your budget.
- Tolerate (Low Value, Low Debt): Leave them alone. They work, aren’t causing problems, and are not important enough to justify modernization costs.
- Retire (Low Value, High Debt): Pure liability. They drain your budget for little business value. Decommission them and reallocate the savings to the “Modernize” quadrant.
The Modernization Decision Framework
With applications scored and segmented, you must map each one to a specific strategy from the “7 Rs” of modernization (Retire, Retain, Rehost, Replatform, Refactor, Rearchitect, Rebuild). A one-size-fits-all approach is a recipe for failure. Applying the right “R” turns analysis into an actionable—and fundable—plan.
| Modernization Pattern | Ideal Application Profile | Key Action |
|---|---|---|
| Retain | High business value, low technical debt. Stable, performant, and low maintenance. | Leave on mainframe. Encapsulate with APIs to expose data and functionality. |
| Retire | Low business value, high technical debt. Drains budget with no strategic return. | Decommission the application. Reallocate saved MIPS and maintenance budget. |
| Rehost | High business value, low technical debt. Stable code where the goal is infrastructure change. | Move the code as-is to a cloud emulator or new environment. Do not rehost high-debt apps. |
| Replatform | High business value, moderate technical debt. Sound logic but needs platform tweaks for cloud benefits. | Make targeted changes, such as migrating a DB2 database to Amazon RDS or Azure SQL. |
| Refactor | High business value, high technical debt. Sound business logic trapped in a problematic codebase. | Use automated tools to convert existing code (e.g., COBOL to Java) without changing external behavior. |
| Rearchitect / Rebuild | High value, but existing architecture is a fundamental business blocker. | Fundamentally alter the application to a modern pattern (e.g., microservices) or start from scratch. Most intensive and expensive option. |
A common mistake is rehosting applications with high technical debt—you are just moving your problems to a more expensive neighborhood. Rehosting does not fix bad code, reduce complexity, or improve maintainability. The global mainframe modernization market is projected to grow from $7.91 billion in 2024 to $18.19 billion by 2033, according to a MarketsandMarkets mainframe modernization report. However, with 67% of migrations failing due to pitfalls like decimal precision errors, this rigorous analysis is the only way to ensure your project doesn’t become another statistic.
Building the Roadmap and Business Case
Your analysis has defined the what and how. Now you must build the business case to get the budget. This means translating strategy into a multi-year roadmap built on financial reality, starting with credible cost estimates.
For refactoring, a per-line-of-code (LOC) metric is the industry-standard starting point. COBOL-to-Java refactoring services run between $1.50 and $4.00 per line of code. This turns a 500,000 LOC application from a vague “large project” into a $750,000 to $2 million refactoring effort—a concrete range that fuels a serious budget request.
Accounting for Hidden Costs
A business case that stops at code conversion will be rejected. The LOC estimate is just the tip of the iceberg. Your cost model must account for these budget-killers:
- Data Migration and Validation: A complex process of schema translation, data cleansing, and exhaustive validation. This phase consumes 15-20% of the total project budget.
- Comprehensive Testing: This includes integration, performance, security penetration, and user acceptance testing. Your testing budget is your insurance policy against a Day 1 catastrophe.
- Parallel Run Environments: You will run the new system alongside the old one for at least one full business quarter to prove functional and data parity. This means paying for two environments at once. It is expensive but non-negotiable.
- Team and Training: Budget for assembling the migration team and retraining operations staff to manage the new cloud-native stack.
A credible business case proves you have identified and priced the mitigation for every major risk. This is what builds stakeholder confidence.
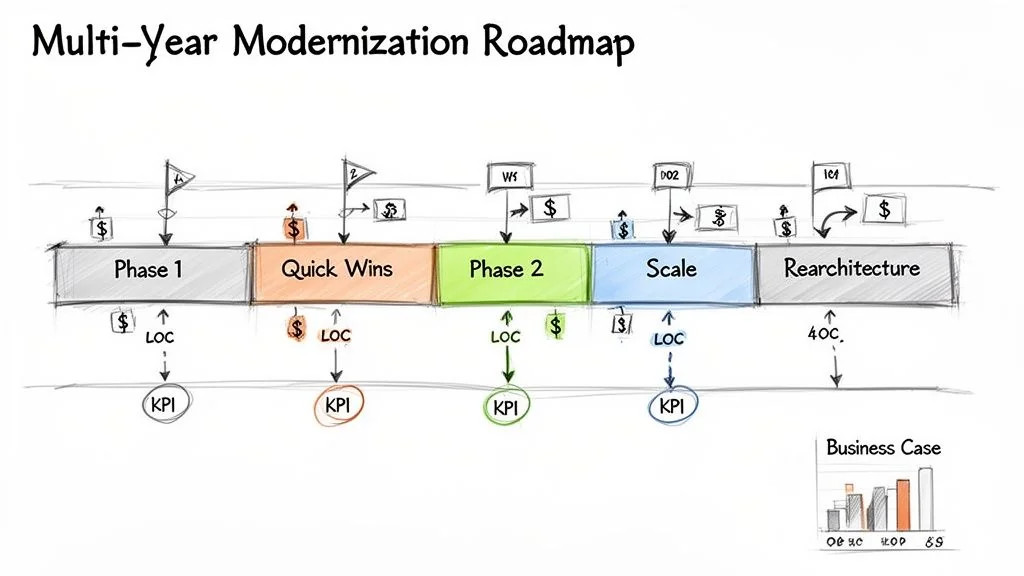
A Phased Roadmap for Momentum and Funding
Avoid proposing a massive, five-year “big bang” project. Instead, build a phased roadmap that delivers value incrementally, creating wins that self-fund subsequent phases.
- Phase 1: Quick Wins (Months 1-9): Retire low-value, high-cost applications to free up MIPS and rehost stable applications to get off expensive hardware. These early successes generate savings and build credibility.
- Phase 2: Strategic Scaling (Months 10-24): Use the capital and budget from Phase 1 to execute your first major refactoring or replatforming project on a high-value, high-debt application cluster, proving your patterns work at scale.
- Phase 3: Core Rearchitecture (Months 25+): With a battle-tested methodology, take on the core business systems that require a full rearchitecture to microservices, funded by the cumulative savings from the first two phases.
This phased approach transforms a daunting technical challenge into a manageable, business-aligned investment program that can survive financial scrutiny.
Next Steps: Executing Your Modernization Plan
With an approved roadmap and budget, execution begins. Modernization programs fail here not from a technical catastrophe, but from a lack of operational discipline. Stand up a dedicated migration factory—a cross-functional team of mainframe veterans and cloud-native developers who live and breathe this program. This fusion is your insurance against building a “cloud-washed” monolith.
Establish Robust Governance
A multi-year program will drift without strong governance. Track key performance indicators (KPIs) from your roadmap: MIPS reduction, developer velocity, and time-to-market for new features. Regular, data-centric reviews provide the compass to navigate inevitable challenges and make informed decisions instead of panic-driven ones.
Active Risk Mitigation Checklist
Active risk management during execution separates success from failure. Obsess over these two critical stages:
- Airtight Testing Strategy: Nearly every post-migration failure traces back to a flimsy testing plan. Your strategy must prove:
- Performance: Does the new system meet or exceed mainframe SLAs under production loads?
- Data Integrity: Does an automated, exhaustive comparison show zero data corruption? Tiny errors in decimal precision can be catastrophic.
- Security: Has the new architecture passed rigorous penetration testing and vulnerability scanning?
- Disciplined Parallel Run: The new and old systems must run side-by-side, processing live production data for at least one full business cycle (e.g., a month or quarter). This validates all periodic and batch processing, not just daily transactions, and builds stakeholder confidence for the final cutover.