A Definitive Mainframe Assessment Methodology for CTOs
Execute a flawless mainframe modernization with our definitive mainframe assessment methodology. Learn to scope, analyze, and build a data-driven business case.
On this page
- Overview
- Why Ad-Hoc Mainframe Assessments Fail
- The True Cost of a Flawed Foundation
- Shifting to a Structured Approach
- The Five Pillars of a Comprehensive Mainframe Assessment
- Pillar 1: Automated Discovery And Dependency Mapping
- Pillar 2: Business Process Correlation
- Pillar 3: Technical Debt And Architectural Health Scoring
- Pillar 4: Modernization Pathway Suitability Analysis
- Pillar 5: Financial Modeling And Business Case Development
- Actionable Framework: Mainframe Assessment Pillars and Key Deliverables
- Automating Discovery and Quantifying Technical Debt
- From Inventory to Insight
- What to Demand from Discovery Tools
- Mapping Technical Assets to Business Value
- From Technical Jargon to Business Capabilities
- The Business Value vs. Technical Health Matrix
- Actionable Framework: The Modernization Decision Matrix
- De-Risking Modernization by Exposing Integration Complexity
- Creating the Integration Map
- Actionable Checklist: Documenting Integration Points
- Using Assessment Data to Vet Modernization Vendors
- From Vague Promises to Concrete Proposals
- Evaluating Vendor Responses
- Next Steps: From Assessment to Execution
A mainframe assessment is the framework that de-risks a multi-million dollar modernization by inventorying every line of code, mapping every dependency, and tying those technical assets back to business outcomes. A flawed assessment is a common reason modernization projects run over budget. Without a structured, data-driven approach, the program is built on guesswork.
Why Ad-Hoc Mainframe Assessments Fail
Treating mainframe assessment as a preliminary checklist is a common mistake. A flawed, informal assessment is among the biggest reasons modernization projects fail, leading to large budget overruns and timelines that stretch well past the plan.
The core problem is simple: most organizations underestimate the interconnectedness of their decades-old mainframe assets. An ad-hoc approach, often relying on outdated documentation or the memory of a few key people, creates a false sense of security.
This improvised analysis misses dependencies buried deep in JCL, schedulers, and undocumented batch processes. When these hidden connections finally surface mid-migration, they trigger costly rework and can stall progress for months. The project, once greenlit based on incomplete data, suddenly faces a scope far larger than anyone planned for.
The True Cost of a Flawed Foundation
The assessment phase produces the architectural blueprint and financial justification executives expect before they fund migration; skipping it or skimming the surface leaves the program exposed in three ways:
- Unforeseen Complexity: Ad-hoc reviews fail to quantify technical debt. They can’t accurately score the cyclomatic complexity of a 30-year-old COBOL program or map the thousands of data touchpoints in aging VSAM files.
- Business Misalignment: Without a structured process, technical teams can't connect cryptic program names to the actual business capabilities they support. This makes it impossible to prioritize what matters most to the organization.
- Vendor Opacity: Without hard data from your own thorough assessment, you can't hold modernization vendors accountable. You’re forced to rely on their estimates, which are often based on optimistic assumptions, not the ground truth of your environment.
A formal assessment turns the modernization plan from a gamble into an evidence-based strategy. It provides the architectural blueprint and financial justification needed to secure executive buy-in.
Shifting to a Structured Approach
A successful mainframe assessment is built on three pillars that directly counter the failures of ad-hoc analysis. First is technical discovery, which means using automated tools to create a complete and accurate inventory of every single code module, data store, and job dependency. No guessing.
Second is business alignment, the process of mapping those technical assets to the business functions they enable. Workshops should tie each program and batch job to the capabilities revenue and operations depend on so spend follows business impact.
Finally, a structured approach includes risk modeling. This quantifies the potential pitfalls and helps you build a phased roadmap that tackles the highest-risk components first, using the same sequencing discipline as a large-scale legacy system modernization program.
The Five Pillars of a Comprehensive Mainframe Assessment
Running a simple code scanner and calling it an "assessment" is a fast way to derail a modernization project. A superficial inventory is a guess, not a strategy. To de-risk a project of this scale, you need a structured, repeatable process that goes beyond counting lines of code.
This methodology is built on five pillars. Each one is designed to produce specific, data-driven outputs that, when combined, create a business case and a technical roadmap you can execute.
Skipping a pillar leaves a gap. The technical, business, and risk failures that plague most modernization projects trace back to an assessment that missed one of these areas.
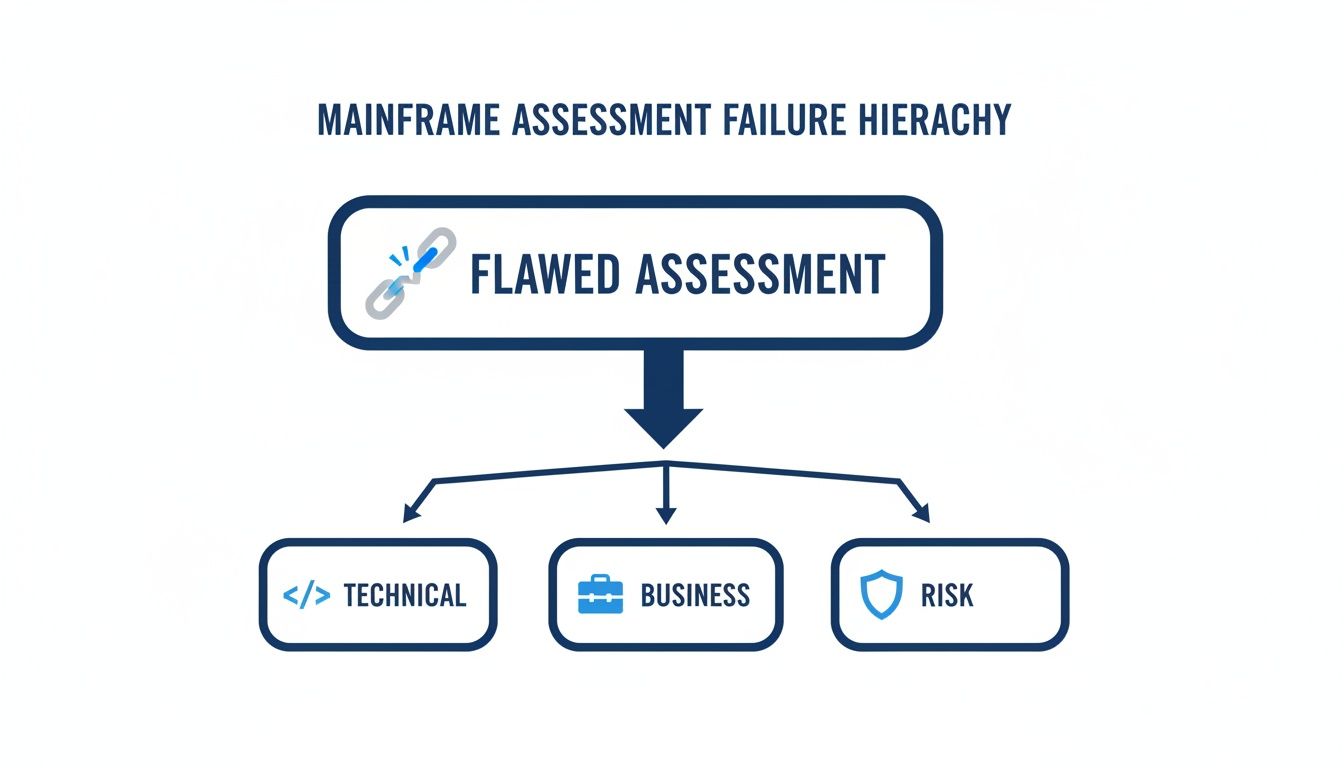
The technical problems, the business misalignment, and the unmanaged risks are all symptoms of the same root cause: an incomplete assessment from day one.
Pillar 1: Automated Discovery And Dependency Mapping
Start by establishing ground truth. Outdated documentation and the institutional knowledge of your senior developers are not reliable enough to plan from. Manual methods tend to fail at this scale.
This pillar is all about automated tooling. You need a system that can scan every line of COBOL, PL/I, and Assembler, and just as importantly, all the surrounding artifacts (JCL, schedulers like CA-7 or ESP, and the data definitions for VSAM, IMS, and DB2).
The goal is a complete dependency graph, not just a list of assets. This map shows precisely how every program, job, and data file connects and interacts.
Pillar 2: Business Process Correlation
A technical inventory, no matter how accurate, is of little use without business context. A list of thousands of COBOL programs tells you little. Which ones process most of your revenue? Which ones support a low-value, sunsetting product line that nobody cares about?
This pillar involves mapping all those discovered technical assets to the actual business capabilities they enable. Sit down with stakeholders and connect a cryptic program name like PYT701B to a real-world function like "Calculate Monthly Payroll."
This step lets you prioritize modernization based on business value, not just technical complexity.
Pillar 3: Technical Debt And Architectural Health Scoring
With a complete, context-aware inventory in hand, you can stop guessing about the health of your portfolio and start measuring it. This pillar is about applying objective scoring models to quantify technical debt and architectural integrity.
Analyze the metrics that expose risk in the code:
- Cyclomatic Complexity: Pinpoint the convoluted "spaghetti code" that’s hard to maintain and risky to change.
- Dead Code Percentage: Identify and measure the unused or unreachable code that just adds noise, bloat, and maintenance overhead.
- Data Model Decay: Analyze copybooks and database schemas to find the inconsistencies and redundancies that can derail a data migration project.
- Security Vulnerabilities: Scan for outdated system calls, insecure coding patterns, or a general lack of adherence to modern security standards.
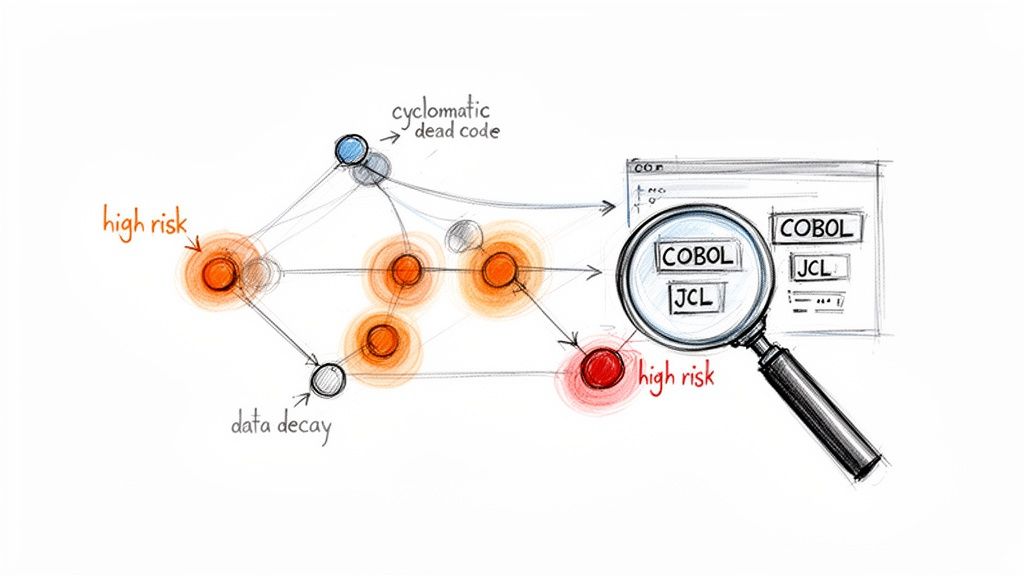
The output is a heat map of your entire application portfolio. It shows which applications are high-risk and high-debt and need immediate attention.
An effective assessment moves the conversation from "We think this system is complex" to a statement like "This application has a technical debt score of 8.5/10, driven by 45% dead code and critical security flaws, posing a direct operational risk."
Pillar 4: Modernization Pathway Suitability Analysis
Not every application should be rewritten from scratch. This pillar uses the hard data from the previous steps to score each application’s suitability for different, specific modernization pathways.
It’s an objective, data-driven analysis that tells you the best-fit approach:
- Rehost (Lift and Shift): The best path for stable applications with low business value. Get them off the mainframe quickly without touching the code.
- Replatform: Suited to applications that can get a quick win from a modern platform (like moving DB2 to a cloud database) without major code changes.
- Refactor/Rearchitect: Necessary for high-value applications that are burdened by technical debt. The business logic is critical, but the underlying structure is failing and needs rebuilding.
- Replace: The right call when a commercial off-the-shelf (COTS) solution provides a better functional fit and a lower total cost of ownership.
Pillar 5: Financial Modeling And Business Case Development
Finally, you have to connect all the technical findings back to money, which the C-suite weighs most. This pillar is all about building a defensible business case by calculating the Total Cost of Ownership (TCO) of your current mainframe versus the projected TCO of the modernized state.
A proper model covers more than hardware and software licenses: it includes the hidden and rising costs of specialized labor, energy consumption, and third-party tools. It also quantifies the ROI of modernizing and the opportunity cost of doing nothing. What business value are you losing every quarter by being stuck on legacy technology?
The financial pressure is only growing. Grand View Research projects the mainframe modernization market will reach USD 18.19 billion by 2033. The growth is driven by a simple reality: organizations still depend on their mainframes, and they also face mounting security risks and integration problems. You can learn more about the key drivers of mainframe modernization projects to see just how widespread this challenge has become.
The table below turns the five pillars into concrete deliverables.
Actionable Framework: Mainframe Assessment Pillars and Key Deliverables
The table outlines each pillar's core focus, key activities, and the output you get at the end of each stage.
| Pillar | Focus Area | Key Activities | Primary Deliverable |
|---|---|---|---|
| 1. Automated Discovery | Establish ground truth | Scan all code (COBOL, JCL, etc.), map data flows, and analyze scheduler interactions. | A complete, interactive dependency graph of the system. |
| 2. Business Correlation | Link technology to value | Conduct workshops with business owners to map applications and programs to specific business capabilities. | A Business Capability Map. |
| 3. Technical Health Scoring | Quantify risk and complexity | Analyze code for complexity, dead code, data model decay, and security vulnerabilities. | An Application Health & Risk Heat Map. |
| 4. Pathway Suitability Analysis | Determine the "how" for each app | Score each application's fit for rehosting, replatforming, refactoring, or replacement. | A Modernization Pathway Recommendation Matrix. |
| 5. Financial Modeling | Build the business case | Calculate current vs. future TCO, ROI, and opportunity cost of inaction. | A comprehensive Business Case and Financial Model. |
Finish all five pillar deliverables in the table before you lock a migration sequence.
Automating Discovery and Quantifying Technical Debt
Assessing a mainframe by manual methods is unlikely to work. Relying on the fading memories of retired experts or binders of outdated documentation is not a strategy. For any system with millions of lines of code, the defensible starting point is automated discovery, which establishes ground truth.
Modern Application Discovery and Understanding (ADU) platforms are required here. They scan everything: COBOL, PL/I, Assembler, and all the surrounding artifacts like JCL, schedulers, and database schemas. This is the practical way to build a complete dependency graph that shows how every single component actually interacts in production.
The goal is a dynamic, searchable model of your entire mainframe environment, not just a list of programs. It reveals hidden, tangled connections that manual reviews typically miss. You'll find things like a single, obscure batch job that writes to a file consumed by a dozen downstream processes, a single point of failure.
From Inventory to Insight
Once that dependency graph is built, quantify technical debt with the objective metrics below instead of relying on anecdote.
A good ADU tool doesn't just give you a list; it scores your applications against objective, industry-standard metrics. This moves the conversation from subjective complaints ("That whole module is a mess") to hard facts ("That module has a cyclomatic complexity of 150").
Your scoring model has to be built on concrete metrics that directly signal risk, maintenance headaches, and migration difficulty.
- Cyclomatic Complexity: This directly measures how many decision paths exist in a program. A score over 50 means the code is practically untestable and very hard to modify without breaking something.
- Dead Code Percentage: Unused paragraphs and dead copybooks are more than clutter. They add noise that slows developers down and bloats the codebase. Finding that a meaningful share of a critical application is dead code is a quick win, showing you exactly where to start cleaning up.
- Data Model Decay: Automated analysis is the practical way to find decay in your data structures. It flags redundant data definitions, inconsistent field types across copybooks, and other data anomalies that will derail a data migration effort.
This quantitative approach lets you build a portfolio-level "heat map." It’s a simple, visual way to spot the highest-risk applications that need immediate attention.
A proper assessment gives you a quantifiable health score for every application. It moves the discussion from "Program XYZ is old" to "Program XYZ has a technical debt score of 87/100 due to severe data model decay and an average cyclomatic complexity of 72, making it our top refactoring candidate."
What to Demand from Discovery Tools
ADU tools vary widely. Some are little more than code parsers, and a file list is not enough: you need analysis you can act on.
When you're evaluating discovery tools, check for these capabilities:
- Cross-Language Analysis: The tool must parse COBOL, PL/I, Assembler, JCL, and scheduler languages to build a complete picture. A tool that only understands COBOL is of limited use.
- Data Flow and Impact Analysis: Can the tool trace a single data field from a copybook, through a dozen programs, to a final database write? This is essential for understanding the real impact of making a change.
- Business Rule Extraction: The best tools can identify and pull business logic out of the code, presenting it in a format a human can actually read. This is invaluable for validating logic during a rewrite.
- Customizable Scoring Models: You need the power to adjust the weighting of technical debt metrics. Your organization's risk tolerance and modernization goals are unique, and your scoring should reflect that.
Automated analysis at this level gives you objective data. It supports defensible decisions, a realistic roadmap, and accountability from everyone, from your internal teams to your modernization vendors.
Mapping Technical Assets to Business Value
An asset inventory is of little strategic use if it's disconnected from business reality. An exhaustive list of COBOL programs, batch jobs, and VSAM files means little to the C-suite, which has no reason to care about ARUP401J.
A successful mainframe assessment translates arcane technical detail into the language of business value, which makes the case for your modernization sequence. Bring dependency maps and inventories into sessions with line-of-business owners so cryptic program names attach to capabilities like "Monthly Accounts Receivable Reconciliation."
Your goal is to move from a list of cryptic program names to a map of real business capabilities, like "Monthly Accounts Receivable Reconciliation." Without this linkage, you will inevitably prioritize the wrong applications, wasting budget on low-value systems while mission-critical assets are ignored.
From Technical Jargon to Business Capabilities
The first step is to sit down with the line-of-business managers, the people who actually own the processes your mainframe enables. You aren't walking in to give them a lecture on mainframe architecture. You’re bringing your discovery outputs, like dependency maps and application inventories, as a starting point for a conversation.
The questions are direct and focused entirely on function:
- "This set of batch jobs runs at the end of every quarter. What business process does it support?"
- "This online CICS transaction is one of the most heavily used. What do your users actually do with it?"
- "If we had to turn this application off for a week, what specific part of the business would grind to a halt?"
You are not asking them to understand COBOL. They explain their world (customer onboarding, claims processing, inventory management) while you map your technical assets to those functions. The result is a translation table between your technical world and their operational one.
The Business Value vs. Technical Health Matrix
Once every major application is tied to a concrete business capability, you can plot them on a simple decision-making tool: the 2x2 matrix.
One axis represents Business Value (from low to high), and the other represents Technical Health (from poor to good), using the quantitative scores from your technical debt analysis. The visualization gives defensible clarity. Every application falls into one of four quadrants, each with a prescribed strategy.
The matrix is a strong communication tool. On a single slide, it shows why you’re recommending a multi-million dollar investment in one application while suggesting you simply tolerate another.
The framework forces a data-driven conversation about priorities and moves the discussion away from office politics and personal opinions.
Actionable Framework: The Modernization Decision Matrix
Each quadrant of the matrix dictates a specific modernization path, reducing debate and providing a logical sequence for your roadmap. The data, not a single architect's opinion, decides the right move for the business.
Business Value vs. Technical Health Decision Matrix
This matrix categorizes applications to create a clear, data-backed modernization strategy. Each quadrant in the table below prescribes invest, refactor, tolerate, or retire before budget debate starts.
| Category (Quadrant) | Business Value | Technical Health | Recommended Strategy |
|---|---|---|---|
| Invest / Modernize | High | Good | These are your most valuable applications. Protect and enhance them. The strategy is to invest in modernization to ensure they remain scalable and secure for the future. |
| Refactor / Replace | High | Poor | These applications are critical but are built on a failing foundation. The high business value justifies the significant cost of refactoring, re-architecting, or replacing them. |
| Tolerate / Maintain | Low | Good | These systems work fine but don't drive significant business value. The strategy is to do minimal maintenance; do not invest modernization budget here. |
| Retire / Decommission | Low | Poor | These are liabilities. They are costly to maintain, brittle, and provide little business value. The clear strategy is to actively plan their retirement. |
The matrix becomes the foundation of your business case, tying each dollar of the proposed budget and each step of the execution plan to a quadrant.
De-Risking Modernization by Exposing Integration Complexity
Integration points are the hidden risk in any mainframe modernization. Underestimating these dependencies is a common cause of scope creep, project delays, and outright failure. A proper mainframe assessment methodology counts lines of code and also exposes every point of contact.
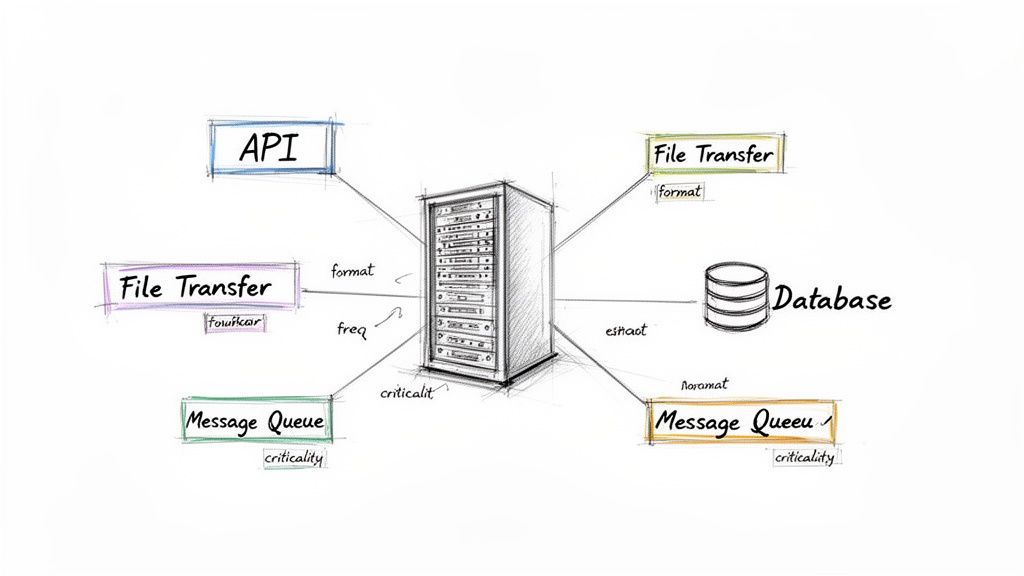
During assessment, catalog every batch transfer, message queue, direct database touchpoint, and API that connects the mainframe to other systems.
They usually fall into a few common buckets:
- Batch File Transfers: The nightly, weekly, and monthly jobs that shuttle flat files around via FTP/SFTP. These are almost always poorly documented and represent a large risk.
- Message Queues: Connections to systems like MQSeries that handle asynchronous chatter with other applications.
- Direct Database Queries: Those external apps someone granted direct read/write access to DB2 or IMS databases years ago.
- API Calls: This goes both ways: inbound calls hitting the mainframe from modern apps and outbound calls made from the mainframe to external services.
The discovery process is large. A typical assessment uncovers a sprawling network of these integration points, and each one carries related dependencies that also need to be tracked. It gets complex, fast.
Creating the Integration Map
The real deliverable from all this digging is a detailed integration map. It is the blueprint you'll use to phase your entire modernization program. For every connection you find, you have to document a specific set of attributes. Without this detail, you're just guessing.
Use the integration map to decide which links should become APIs for microservices or other modern interfaces so no critical dependency is left behind when you cut over. A solid integration map is a prerequisite for this kind of work and underpins a broader cloud readiness assessment.
The integration map is a core deliverable. It determines your migration sequence, defines your testing scope, and prevents the "we forgot about that system" moment six months into the project.
Actionable Checklist: Documenting Integration Points
To make this map useful, you have to be consistent. A simple spreadsheet often does the trick, but it has to be comprehensive. Using a standard template for every integration ensures no detail gets missed.
| Attribute | Description | Example |
|---|---|---|
| Integration ID | A unique identifier for the connection. | INT-042 |
| Source System | The application initiating the connection. | Mainframe Payroll (PY701B) |
| Target System | The application receiving the connection. | External HR SaaS Platform |
| Protocol/Method | The technology used (e.g., SFTP, API, MQ). | SFTP |
| Data Format | The structure of the data (e.g., EBCDIC flat file). | EBCDIC fixed-width file |
| Frequency | How often the integration runs. | Daily, 2:00 AM EST |
| Business Criticality | Impact of failure (High, Medium, Low). | High |
| Owner | The business stakeholder responsible. | Director of HR |
This documentation takes you from a vague understanding of how systems talk to each other to a precise, actionable plan. It lets you build replacements systematically as you shut down pieces of the mainframe, without breaking the business.
Using Assessment Data to Vet Modernization Vendors
Use the completed assessment to test vendor sales pitches and ground the conversation in reality. With this data, vendors have to prove their worth on your terms, against the documented complexity of your actual system.
Generic RFPs asking for case studies and team bios invite boilerplate responses that tell you little. Instead, give shortlisted vendors a curated, anonymized slice of your assessment findings. This forces them to address your real problems.
From Vague Promises to Concrete Proposals
Structure your RFP around specific, difficult questions pulled directly from your assessment data. The goal is to see how vendors think and solve problems, as well as to get a price. You present them with a representative piece of your environment and ask for a fixed-price statement of work for a well-defined pilot project.
Your questions need to be precise. Replace "How do you handle migrations?" with questions like these (the figures are examples; substitute your own assessment numbers):
- "We have identified 150 critical batch job chains with intricate cross-application dependencies. Show us a detailed plan for how you'll untangle and manage this dependency web during a phased migration."
- "Our code analysis flagged that 30% of our core business logic is buried in Assembler modules being called by COBOL programs. What specific tooling and methodology will you use to convert this logic without breaking the bank or the business?"
- "What is your exact strategy for migrating 5TB of VSAM data defined by COBOL copybooks full of packed-decimal (COMP-3) fields? How will you guarantee data fidelity and prevent silent precision loss when moving this to a relational database?"
A vendor’s inability to give a detailed, technically sound answer to these questions is grounds for disqualification. It suggests they lack real-world experience with the specific problems you know you have.
Evaluating Vendor Responses
This method makes proposal evaluation more straightforward and defensible. You're no longer comparing slick marketing brochures; you're comparing detailed engineering solutions to your documented challenges.
Look for specificity above all else. A weak response is vague, like: "We will leverage our proprietary tools to ensure data integrity." A strong response sounds like this: "For COMP-3 fields, we use a two-step process. First, we stage the data in an intermediate format, apply a specific bit-masking and conversion algorithm to handle the packed-decimal representation, then load to PostgreSQL. We run parallel validation jobs against a data snapshot to guarantee 100% fidelity."
This evidence-based approach separates partners with deep mainframe expertise from generalist IT shops. It helps you pick a team that can handle the system you have, not the one they hoped you had.
Next Steps: From Assessment to Execution
Completing a rigorous assessment is the starting point for modernization, not the end. Use its deliverables to secure final executive buy-in, finalize vendor selection based on data-driven evaluations, and begin executing a pilot project against a well-defined, high-priority segment of your application portfolio identified during the assessment.
Chief Analyst, Software Modernization Intelligence · 10+ years B2B market research
Published: