
Why 60% of Modernization Efforts Suffer from Blinding Visibility Gaps
Your legacy monitoring tools are obsolete, and they are creating a significant operational risk. Built for monolithic applications and predictable release cycles, these tools are functionally blind in a world of microservices, serverless functions, and containers. This isn’t a minor inconvenience; it’s a direct contributor to slower deployments and prolonged, costly outages.
Why Traditional Monitoring Fails In Modern Systems
The architectural shift from monoliths to distributed systems invalidates the core assumptions of traditional monitoring. Legacy tools were designed for a static environment where a server could be reliably tracked by its IP address. This concept is useless when a container can be provisioned, execute a task, and terminate in under a second.
Consider this analogy: traditional monitoring is like a security guard assigned to patrol a fixed route in a quiet suburban neighborhood. This works when the addresses are static and the layout doesn’t change.
A modern, cloud-native system is not a suburb; it’s a metropolis where infrastructure is provisioned and de-provisioned dynamically. Patrolling fixed routes is ineffective. You need to understand the flow of traffic, power, and communications across the entire grid—the surges, the brownouts, the unpredictable demand patterns.
Observability provides this grid-level view. Traditional monitoring is still checking static addresses.
The Disconnect Between Old Tools and New Architectures
The fundamental issue is a mismatch between tool design and system reality. Legacy monitoring is designed for predefined dashboards and alerts for “known-unknowns”—problems you can anticipate, such as CPU utilization exceeding 90%.
Modern systems, however, are characterized by “unknown-unknowns”—novel failure modes that emerge from the complex interactions between hundreds of distributed services. You cannot configure an alert for a failure you have never encountered.
- Ephemeral Infrastructure: Monitoring agents configured with a static server name or IP address become useless the moment that resource is replaced. All historical context is lost.
- Distributed Complexity: A single user action can initiate a transaction that traverses 50 different services. A traditional tool might flag one service as “slow” but cannot trace the latency back to an upstream dependency that is the actual root cause.
- Deployment Velocity: High-performing teams have shifted from quarterly releases to multiple deployments per day. Each change introduces risk, and legacy tools lack the granularity and speed to correlate deployments with system failures.
According to IDC, 60% of engineers report that their current monitoring tools are too siloed, failing to provide a unified view of hybrid and multi-cloud environments. This visibility gap is a primary source of operational friction and risk. You can find more data in this detailed report on the state of modern monitoring.
In practice, this gap means engineers spend critical incident response time attempting to manually correlate data from a dozen disconnected tools instead of resolving the issue. The results are longer outages, stalled product development, and accumulating technical debt.
Observability is not an incremental upgrade. It is the required capability to manage the inherent complexity of modern distributed systems.
Understanding The Pillars Of Modern Observability
Closing the visibility gap requires a different approach to data collection. Effective observability in modernized systems is not about collecting more data; it’s about collecting the right telemetry and, critically, understanding the relationships between different data types. It is built on a foundation of correlated telemetry that allows engineers to ask arbitrary questions about system behavior.
Consider managing a logistics network. An alert stating a package is “delayed” is analogous to traditional monitoring—it’s a fact without context. Observability provides the correlated data needed to investigate why. Was the delay caused by a vehicle malfunction, an incorrect address, or a specific traffic bottleneck?
This is the central problem. Tools designed for a single application cannot introspect the complex, distributed nature of microservices.
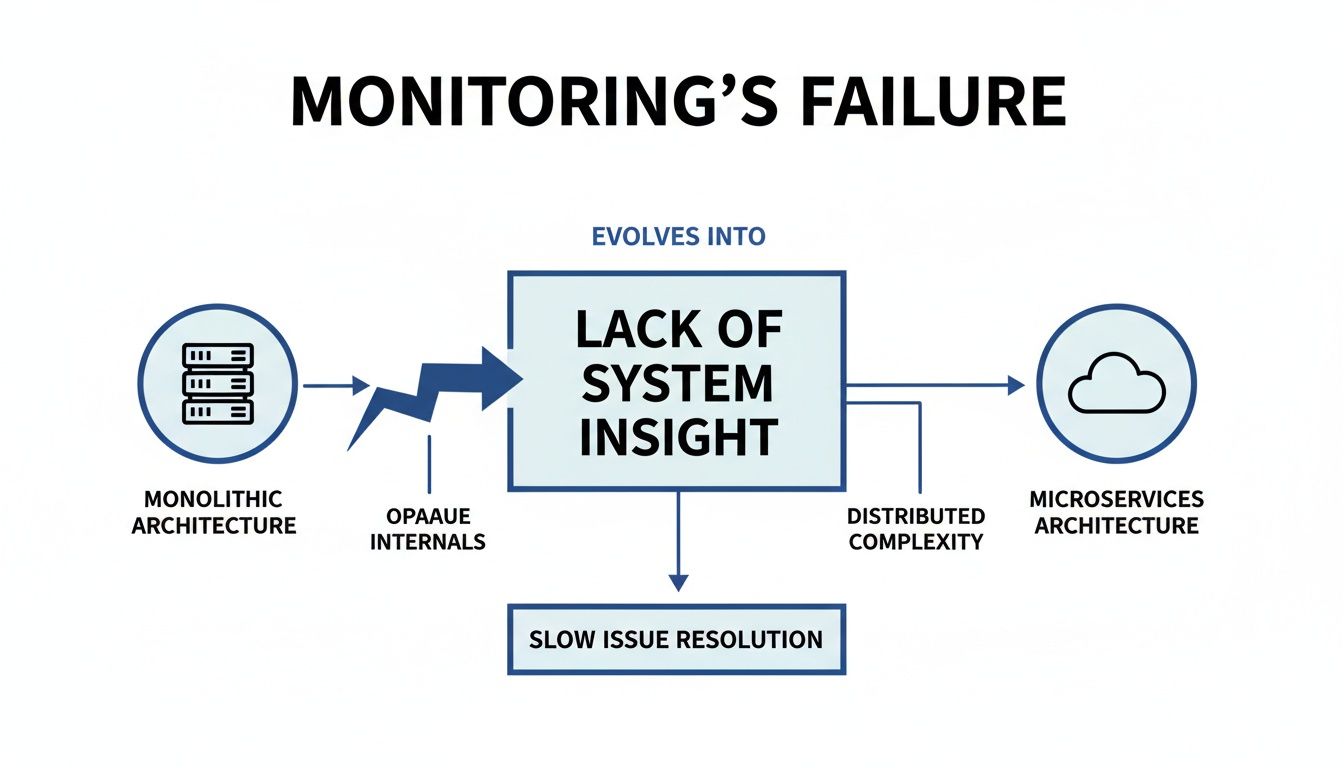
As architectures evolve from the monolith on the left to the distributed system on the right, traditional monitoring methods become ineffective. Engineering teams lose the ability to connect a failure in one service to its root cause several services upstream.
From Raw Data To Actionable Insight
At the heart of observability are four core data types. Each addresses a different type of question, but their diagnostic power is realized only when an engineer can pivot between them seamlessly during an investigation. The scope has expanded beyond application performance; understanding what data observability truly means now includes the health and reliability of the entire data pipeline.
Here is a breakdown of the foundational telemetry types.
Core Telemetry Types For Modern Systems
| Telemetry Type | What Question It Answers | Example Use Case In Microservices |
|---|---|---|
| Metrics | What is the overall state? | Your api-gateway shows CPU utilization is at 90%, or your payment-service p99 latency has spiked. Metrics provide a high-level view. |
| Logs | What specific event happened? | A metric shows an increase in the error rate. A log from the user-service reveals the specific error: “FATAL: database connection refused.” |
| Traces | Where is the problem happening? | A user reports a slow checkout. A trace shows the request hitting 5 services, but spending 95% of its time waiting for a response from the inventory-service. |
| Profiling | Why is the code slow or expensive? | The trace points to the inventory-service. Profiling isolates the exact line of code—an inefficient N+1 database query—that is consuming excessive CPU. |
No single telemetry type provides the complete picture. You need the metric to identify the trend, the log to find the specific error, the trace to locate the bottleneck service, and profiling to pinpoint the inefficient code.
The Emerging Fourth Pillar: Continuous Profiling
While logs, metrics, and traces describe what a system is doing, continuous profiling explains how efficiently it is doing it. This is the emerging fourth pillar, providing a constant, low-overhead view of code-level resource consumption—CPU and memory—in production environments.
If a trace is a GPS route for a request, continuous profiling is the fuel efficiency monitor for the vehicle’s engine. It shows which specific functions are consuming the most resources, enabling performance optimization and infrastructure cost reduction.
By analyzing CPU and memory usage down to the function level, engineers can identify performance bottlenecks that are otherwise invisible. For example, a single inefficient regular expression or a poorly optimized query could be consuming significant CPU cycles across a fleet of servers, increasing cloud spend without triggering a traditional alert.
The objective is not to populate dashboards. It is to build a rich, interconnected dataset that allows engineers to move beyond predefined queries and explore the “unknown-unknowns” that cause outages in complex systems. During an incident, they can slice and analyze this data to test hypotheses and rapidly isolate the root cause.
The Top 3 Observability Implementation Failures
Adopting observability is not just a tool procurement; it is a strategic shift in how you operate software. Many initiatives fail, not due to a lack of technical skill, but because of a flawed implementation strategy. Understanding these common failure patterns is the first step toward building an effective observability practice.
Let’s break down the three most common ways these projects fail.
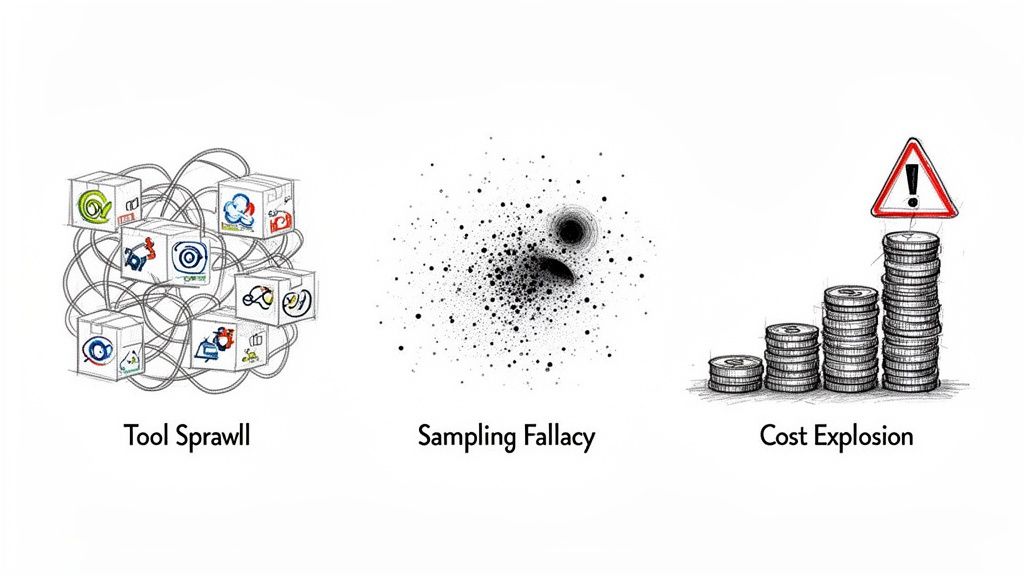
Failure 1: The Tool Sprawl Trap
The most common failure is accumulating a fragmented set of monitoring tools. This typically happens organically as teams adopt point solutions: one tool for logs, another for infrastructure metrics, a third for APM. The result is a disjointed and inefficient operational environment.
This “tool sprawl” creates data silos. During an incident, engineers must manually switch between multiple UIs, attempting to correlate data while the system is down. Each tool has a different query language, data retention policy, and set of blind spots, making a coherent view impossible.
The data confirms this. A recent observability forecast found that 66% of respondents use four or more observability tools, and 52% use six or more. This creates a direct tax on engineering time and Mean Time to Resolution (MTTR).
You cannot effectively debug a distributed system when your telemetry is scattered across incompatible platforms. The result is consistently alert fatigue, inflated MTTR, and frustrated engineers.
Effective observability requires a unified platform or a coherent data federation strategy. Otherwise, you are just paying for more dashboards that do not interoperate.
Failure 2: The Sampling Fallacy
As telemetry data volumes increase, the default response is often to implement sampling. The logic seems sound: reduce costs by capturing only a fraction of traces or logs. Vendors often promote this as a way to get a “representative picture” of performance.
This is a critical mistake.
Sampling is optimized for common, low-value events. It is effective at measuring the average latency of your homepage but is ineffective at capturing the rare, high-impact events that cause major outages. These are the “needles in the haystack” that sampling is designed to discard.
Consider what is lost with sampling:
- The “One-in-a-Million” Bug: A critical error affecting a small subset of users with a specific configuration will almost certainly be missed by aggressive sampling.
- Security Threats: A low-and-slow attack pattern does not generate a high volume of signals. Sampling discards the very data points needed to detect a breach.
- Cascading Failures: The initial event that triggers a system-wide outage is often a single anomaly in a non-critical service. If that trace is dropped, you lose all context for the subsequent failure.
You cannot know which data point will be critical until after the fact. By sampling upfront, you are making a bet that you can afford to ignore outliers. In complex systems, outliers are often the most important signals. This also undermines practices like contract testing between microservices and legacy systems, where every transaction trace is needed to detect a breaking change.
Failure 3: The High Cardinality Cost Explosion
The third predictable failure is an uncontrolled cost increase driven by high-cardinality data. Cardinality refers to the number of unique values for a given label or tag. For example, a metric tag for http_status_code has low cardinality (e.g., 200, 404, 500).
In contrast, a tag like user_id or request_id has extremely high cardinality, with potentially millions or billions of unique values.
When engineers instrument code without understanding this, they can create a financial liability. Adding a customer_id tag to a metric seems useful, but it generates a unique time series for every customer. Observability vendors bill based on the number of unique time series ingested, and costs can grow exponentially.
For example, tracking request latency per customer: request.latency{customer_id="customer-a", endpoint="/api/v1/cart"}. For one million customers, this single metric generates one million unique time series. With platform pricing ranging from $0.01 to $0.10 per time series per month, this can result in a surprise $10,000-$100,000 monthly bill for one poorly instrumented metric.
This cost explosion often leads to budget cuts, forcing engineers to discard valuable data to control spending. A viable observability strategy requires strict governance over metric creation to manage cardinality and cost.
Calculating The Financial Impact Of Full-Stack Observability
Investing in observability in modernized systems is frequently framed as a technical requirement, but its value must be articulated in financial terms. To secure budget, the conversation must connect engineering metrics like Mean Time To Resolution (MTTR) to direct business outcomes.
A mature observability practice is not an expense; it is an investment that reduces financial losses from outages, inefficient incident response, and operational drag. The most straightforward justification is to calculate the cost of not having it.
Every minute a critical system is down results in lost revenue, eroded customer trust, and unproductive engineering hours spent in incident war rooms instead of developing new features. Observability provides a tight feedback loop, converting technical insights into measurable financial returns.
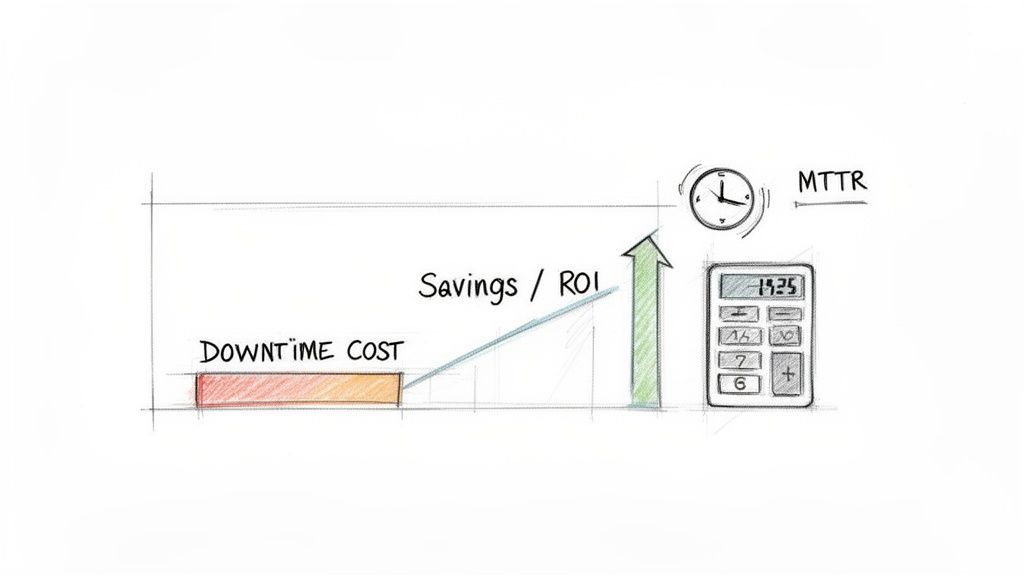
Quantifying The Cost Of Downtime
The most direct financial impact is the reduction of outage frequency and duration. A simple model for calculating this cost is:
(Lost Revenue per Minute + Lost Productivity per Minute) x Incident Duration in Minutes
For an e-commerce platform, lost revenue can be calculated from average transaction volume. For a B2B SaaS platform, the cost may be in the form of SLA penalties or customer churn. The objective is to assign a realistic dollar value to each minute of downtime.
New Relic’s 2023 observability forecast found that organizations with full-stack observability reported median annual outage costs of $6.17 million. In contrast, organizations without it reported costs of $9.83 million.
That represents an annual cost reduction of $3.66 million, or 37%, directly attributable to improved system visibility.
The data shows a clear correlation: better system visibility leads to faster issue resolution and reduced financial losses.
Calculating Engineering Productivity Gains
The second component of ROI is reallocating engineering time from incident response to value-creating work. Without observability, debugging a distributed system is a time-consuming, low-value activity. Engineers spend hours or days manually correlating data from disconnected tools to find a root cause.
To calculate these savings, use the following inputs:
- Time Saved per Incident: Estimate the number of hours spent troubleshooting major incidents. An effective observability platform can often reduce this by 50-75%.
- Engineer Cost: Use a fully-loaded hourly rate for a senior engineer, including salary, benefits, and overhead.
- Incident Frequency: Determine the number of P1/P2 incidents per month.
The formula is: (Hours Saved per Incident) x (Engineer Hourly Rate) x (Incidents per Month) x 12
For example, a team that saves 10 hours of troubleshooting time on four incidents per month, with a loaded engineer rate of $100/hour, realizes an annual productivity gain of $48,000. This is not a cost-cutting measure; it is a strategic reallocation of high-value talent to revenue-generating activities.
The Hidden Value of Risk Mitigation
Finally, there is the financial benefit of de-risking the modernization effort itself. Full-stack observability acts as a safety net, enabling teams to deploy changes faster and with higher confidence.
This has direct implications for financial planning. Effective observability exposes infrastructure waste, enabling better cloud cost optimization strategies and preventing budget overruns. It significantly reduces the risk of a catastrophic, brand-damaging outage that could impact a major product launch or quarterly financial targets.
When you combine the direct savings from reduced downtime, the productivity gains from faster troubleshooting, and the value of risk mitigation, the business case for observability becomes clear. It transitions from an engineering expense to a core driver of financial stability and operational excellence.
How To Select An Observability Partner
Selecting an observability partner is a major commitment. It is not just a tool purchase; it is a multi-year technical and financial contract that is difficult and costly to exit. The market is saturated with vendors making similar claims, but their underlying technology and pricing models differ significantly.
An incorrect choice can lead to vendor lock-in, uncontrolled costs, and a platform that fails under load during a critical incident.
The objective is to look past marketing demonstrations and rigorously evaluate a platform’s ability to handle the complexity of observability in modernized systems. This requires asking specific, technical questions that force vendors to substantiate their claims.
Assess Core Technical Capabilities
Before reviewing pricing, you must validate that the platform can operate effectively within your distributed architecture. Many tools perform well when monitoring a simple monolith but fail when confronted with asynchronous event buses, service meshes, and ephemeral infrastructure. A vendor’s answers to these questions will reveal the maturity of their platform.
Key technical capabilities to evaluate:
- Unified Data Correlation: Ask for a demonstration of navigating from a metric showing a latency spike, to the specific traces causing it, and then to the logs from the involved pods—all within a few clicks. If the process involves switching UIs or writing complex joins, the platform is not truly unified.
- OpenTelemetry Commitment: Ask about their native support for OpenTelemetry (OTel). A vendor fully committed to OTel provides the best defense against lock-in by ensuring instrumentation is portable. A key follow-up is, “Do you natively ingest OTLP, or do you require a proprietary agent for translation?”
- Asynchronous System Tracing: Modern systems rely heavily on message queues like Kafka or RabbitMQ. Require a demonstration of how their platform correlates a trace across an asynchronous boundary. This is a common failure point for many platforms, which cannot stitch together transactions that do not follow a simple request-response model.
The benchmark for a serious observability platform is the ability to trace a single transaction from a mobile app click, through a dozen microservices, and into a mainframe COBOL program. If a partner cannot provide this end-to-end visibility for a hybrid architecture, you will have significant blind spots.
Scrutinize The Pricing Model For Hidden Costs
Observability pricing is complex and often designed to obscure the true total cost of ownership. The pricing model will have a greater long-term budget impact than the initial quote. For additional guidance on vetting partners, refer to our analysis of top DevOps consulting companies.
Let’s analyze the common models and their financial risks.
Vendor Pricing Model Analysis
Observability vendors typically use one of a few core pricing models, each with specific trade-offs.
| Pricing Model | Best For | Common Pitfall To Watch For |
|---|---|---|
| Per-Host / Per-Agent | Predictable budgeting for stable, VM-based infrastructure. | Becomes cost-prohibitive in dynamic containerized environments where host counts fluctuate, leading to payment for idle capacity. |
| Data Volume (GB Ingested) | Environments with low-to-moderate data volume that require full-fidelity log storage. | Penalizes comprehensive instrumentation. As engineers add more detailed telemetry, your bill increases unpredictably. |
| Consumption-Based / User | Teams that want to align costs directly with platform usage and value derived. | High-cardinality custom metrics can create significant, unexpected cost overages. The vendor must provide robust cost governance tools. |
The single most important financial question to ask a vendor is:
“Show me exactly how you price custom metrics with high-cardinality dimensions, like customer_id or session_id.”
Their answer will reveal whether their platform is designed for modern architectures or if it will create a financial liability. A credible partner will offer transparent pricing and tools to manage cardinality-driven costs proactively.
When You Should Not Invest In A New Platform
Investing in a new observability platform is a significant commitment of capital and engineering time. A platform is a tool, not a substitute for a coherent strategy or organizational alignment. There are specific scenarios where delaying procurement is the most prudent decision. Proceeding without addressing foundational issues will likely result in a failed implementation and an expensive, underutilized tool.
Your Modernization Is In Early Planning
If your team is still in the architectural design phase, a full-scale platform investment is premature. Observability in modernized systems must be designed into the architecture, not added as an afterthought. A tool optimized for serverless functions may be a poor fit for a Kubernetes-based service mesh.
You should wait if:
- Key architectural decisions are pending. The choice between event-driven and synchronous communication patterns has not been finalized.
- Technology choices are not final. The selection of a message bus or service mesh is still under debate.
- The initial scope is a small pilot. The telemetry from a two-service proof-of-concept is insufficient to justify the cost and complexity of a full platform.
Investing before your architecture solidifies is like buying furniture for a house that has not yet been designed. You are likely to acquire expensive assets that do not fit the final structure.
Your Core System Is A Stable Monolith
If a significant portion of your revenue is generated by a stable, well-understood monolithic application monitored by a functional legacy APM tool, replacing it may be an unnecessary expense and risk. Many mainframes and legacy monoliths have decades of operational knowledge embedded in their existing monitoring configurations.
For example, a traditional APM tool is often sufficient for tracking transaction behavior within a CICS region on a mainframe. While there is value in integrating this data into a modern platform, a “rip and replace” strategy for a functioning system presents a high-risk, low-reward scenario. The more logical first step is to integrate the monolith’s telemetry, not replace its core monitoring.
Burning Questions
Here are direct answers to common questions from leaders developing an observability strategy.
Is Observability Just a Rebrand of APM?
No. The distinction is critical. APM (Application Performance Monitoring) is analogous to a car’s dashboard. It tracks known metrics—speed, fuel level, engine temperature. It is designed to answer “known-unknowns,” such as when CPU on a specific server exceeds a threshold. You know to monitor CPU; you just don’t know its current value.
Observability is analogous to a Formula 1 telemetry system. It collects high-fidelity data from hundreds of sensors, allowing the pit crew to ask any question to diagnose novel problems. It is built for the complexity of distributed systems, enabling you to investigate “unknown-unknowns.” APM is for monitoring; observability is for investigation.
How Big of a Deal is OpenTelemetry?
It is a non-negotiable, foundational requirement for any modern observability strategy. Do not consider a platform that lacks deep, native support for OpenTelemetry (OTel).
OTel is the open-source, vendor-neutral standard for instrumenting applications. It is your primary defense against vendor lock-in.
Adopting OTel ensures your instrumentation code is portable. If your vendor significantly increases prices or their product stagnates, you can migrate to a different backend without a multi-year project to re-instrument hundreds of services. A vendor’s commitment to OTel is a strong indicator of their commitment to an open ecosystem.
Can’t We Just Build This In-House?
You can, but it is almost certainly a poor financial decision. While the open-source stack—Prometheus for metrics, Grafana for dashboards, and Jaeger for traces—is powerful, operating it at enterprise scale is a significant engineering challenge. The total cost of ownership (TCO) will almost always exceed the cost of a commercial platform.
Consider these hidden costs:
- The Platform Team Tax: You will need to dedicate 3-5 senior engineers to build, scale, secure, and maintain your internal observability stack full-time.
- The Opportunity Cost: These 3-5 engineers are no longer developing features that generate revenue. They become a cost center supporting an internal tool.
- The Big Data Problem: Managing petabytes of high-cardinality telemetry data is a massive data engineering challenge that specialized vendors have invested hundreds of millions of dollars to solve.
For most companies, purchasing a managed solution is the correct financial decision. It allows your best engineers to focus on your core product, not on operating a distributed time-series database.
Modernization Intel delivers the unbiased research you need to make defensible vendor decisions. We provide the unvarnished truth about implementation partners—their real costs, typical failure rates, and actual specializations—so you can choose your partners with total confidence. Get the intel you need to de-risk your next project.